Note
Click here to download the full example code
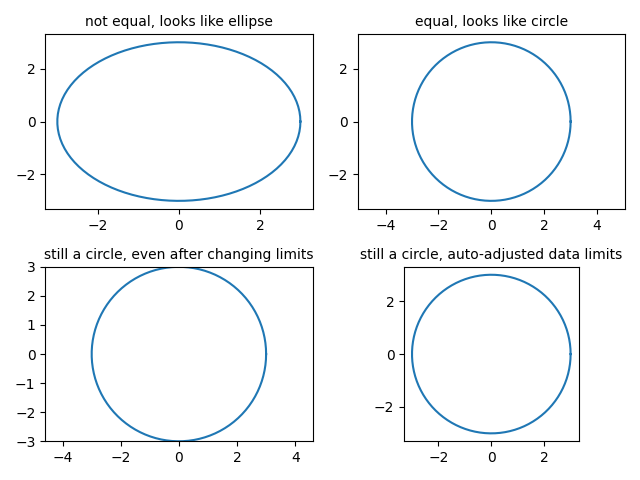
Equal axis aspect ratio#
How to set and adjust plots with equal axis aspect ratios.
import matplotlib.pyplot as plt
import numpy as np

# Plot circle of radius 3.

an = np.linspace(0, 2 * np.pi, 100)
fig, axs = plt.subplots(2, 2)

axs[0, 0].plot(3 * np.cos(an), 3 * np.sin(an))
axs[0, 0].set_title('not equal, looks like ellipse', fontsize=10)

axs[0, 1].plot(3 * np.cos(an), 3 * np.sin(an))
axs[0, 1].axis('equal')
axs[0, 1].set_title('equal, looks like circle', fontsize=10)

axs[1, 0].plot(3 * np.cos(an), 3 * np.sin(an))
axs[1, 0].axis('equal')
axs[1, 0].set(xlim=(-3, 3), ylim=(-3, 3))
axs[1, 0].set_title('still a circle, even after changing limits', fontsize=10)

axs[1, 1].plot(3 * np.cos(an), 3 * np.sin(an))
axs[1, 1].set_aspect('equal', 'box')
axs[1, 1].set_title('still a circle, auto-adjusted data limits', fontsize=10)

fig.tight_layout()

plt.show()
Keywords: matplotlib code example, codex, python plot, pyplot Gallery generated by Sphinx-Gallery