Note
Click here to download the full example code
Fill Betweenx Demo#
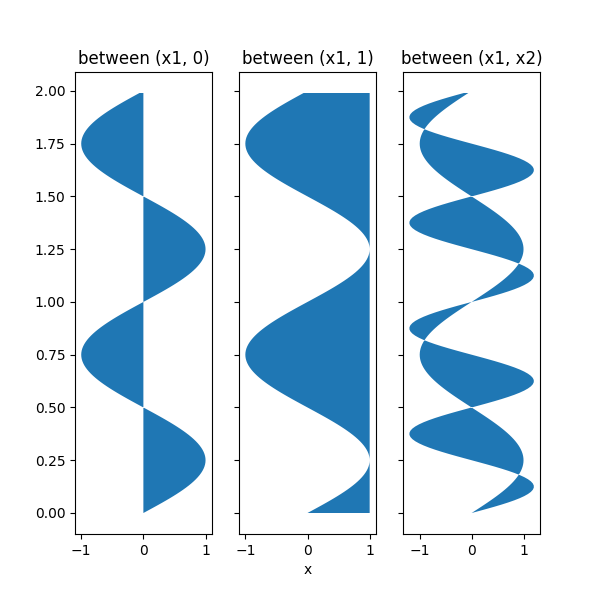
Using fill_betweenx to color along the horizontal direction between
two curves.
import matplotlib.pyplot as plt
import numpy as np


y = np.arange(0.0, 2, 0.01)
x1 = np.sin(2 * np.pi * y)
x2 = 1.2 * np.sin(4 * np.pi * y)

fig, [ax1, ax2, ax3] = plt.subplots(1, 3, sharey=True, figsize=(6, 6))

ax1.fill_betweenx(y, 0, x1)
ax1.set_title('between (x1, 0)')

ax2.fill_betweenx(y, x1, 1)
ax2.set_title('between (x1, 1)')
ax2.set_xlabel('x')

ax3.fill_betweenx(y, x1, x2)
ax3.set_title('between (x1, x2)')
Out:
Text(0.5, 1.0, 'between (x1, x2)')
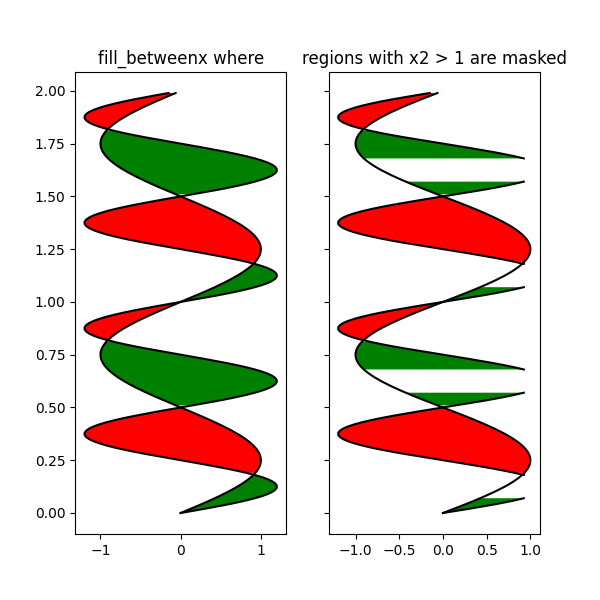
Now fill between x1 and x2 where a logical condition is met. Note this is different than calling:
because of edge effects over multiple contiguous regions.
fig, [ax, ax1] = plt.subplots(1, 2, sharey=True, figsize=(6, 6))
ax.plot(x1, y, x2, y, color='black')
ax.fill_betweenx(y, x1, x2, where=x2 >= x1, facecolor='green')
ax.fill_betweenx(y, x1, x2, where=x2 <= x1, facecolor='red')
ax.set_title('fill_betweenx where')

# Test support for masked arrays.
x2 = np.ma.masked_greater(x2, 1.0)
ax1.plot(x1, y, x2, y, color='black')
ax1.fill_betweenx(y, x1, x2, where=x2 >= x1, facecolor='green')
ax1.fill_betweenx(y, x1, x2, where=x2 <= x1, facecolor='red')
ax1.set_title('regions with x2 > 1 are masked')
Out:
Text(0.5, 1.0, 'regions with x2 > 1 are masked')
This example illustrates a problem; because of the data gridding, there are undesired unfilled triangles at the crossover points. A brute-force solution would be to interpolate all arrays to a very fine grid before plotting.
plt.show()
Total running time of the script: ( 0 minutes 1.131 seconds)
Keywords: matplotlib code example, codex, python plot, pyplot Gallery generated by Sphinx-Gallery