Note
Click here to download the full example code
Custom Ticker1#
The new ticker code was designed to explicitly support user customized
ticking. The documentation of matplotlib.ticker details this
process. That code defines a lot of preset tickers but was primarily
designed to be user extensible.
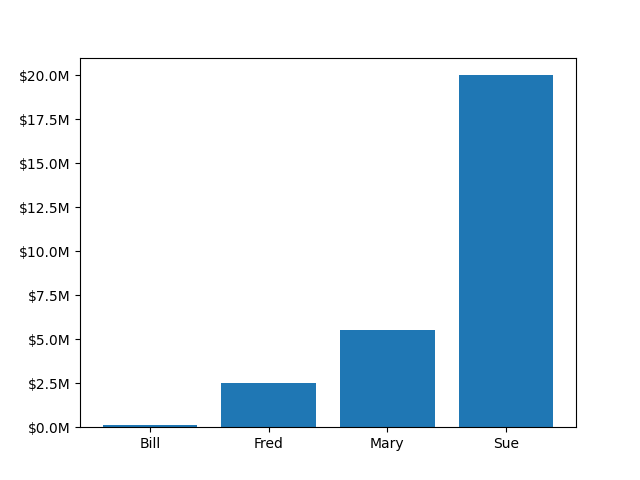
In this example a user defined function is used to format the ticks in millions of dollars on the y axis.
import matplotlib.pyplot as plt

money = [1.5e5, 2.5e6, 5.5e6, 2.0e7]


def millions(x, pos):
    """The two arguments are the value and tick position."""
    return '${:1.1f}M'.format(x*1e-6)

fig, ax = plt.subplots()
# Use automatic FuncFormatter creation
ax.yaxis.set_major_formatter(millions)
ax.bar(['Bill', 'Fred', 'Mary', 'Sue'], money)
plt.show()
References
The use of the following functions, methods, classes and modules is shown in this example:
Keywords: matplotlib code example, codex, python plot, pyplot Gallery generated by Sphinx-Gallery