Note
Click here to download the full example code
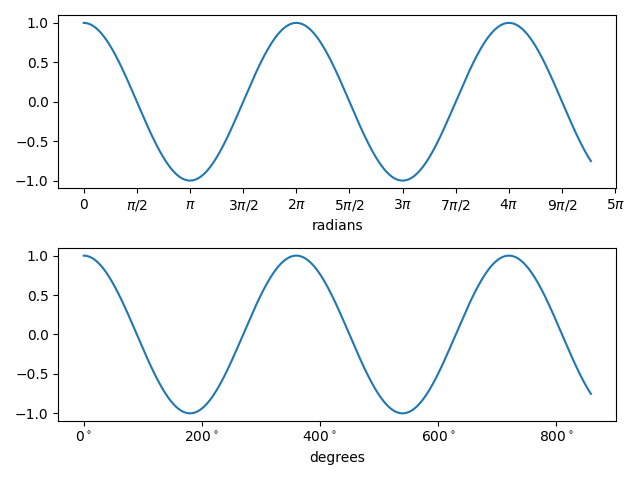
Radian ticks#
Plot with radians from the basic_units mockup example package.
This example shows how the unit class can determine the tick locating, formatting and axis labeling.
This example requires basic_units.py
Keywords: matplotlib code example, codex, python plot, pyplot Gallery generated by Sphinx-Gallery