Note
Click here to download the full example code
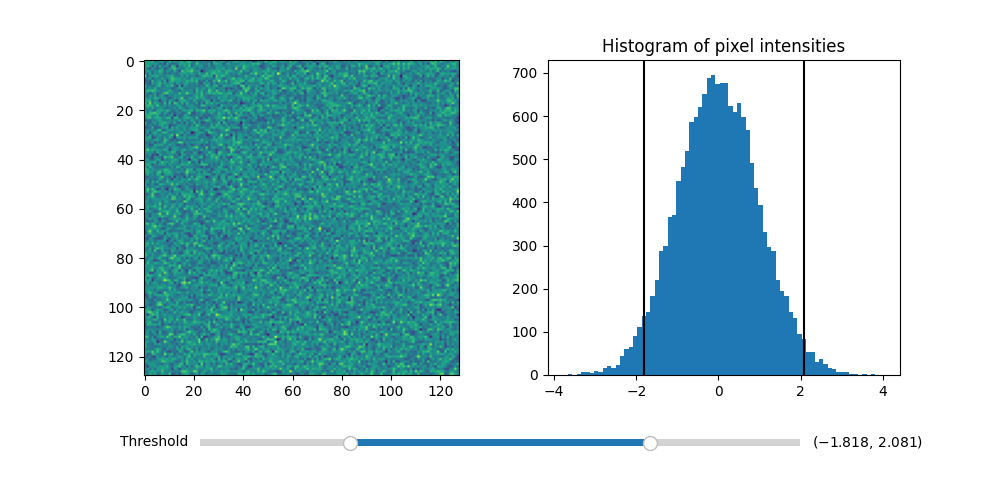
Thresholding an Image with RangeSlider#
Using the RangeSlider widget to control the thresholding of an image.
The RangeSlider widget can be used similarly to the widgets.Slider
widget. The major difference is that RangeSlider's val attribute
is a tuple of floats (lower val, upper val) rather than a single float.
See Slider for an example of using
a Slider to control a single float.
See Snapping Sliders to Discrete Values for an example of having
the Slider snap to discrete values.
import numpy as np
import matplotlib.pyplot as plt
from matplotlib.widgets import RangeSlider

# generate a fake image
np.random.seed(19680801)
N = 128
img = np.random.randn(N, N)

fig, axs = plt.subplots(1, 2, figsize=(10, 5))
plt.subplots_adjust(bottom=0.25)

im = axs[0].imshow(img)
axs[1].hist(img.flatten(), bins='auto')
axs[1].set_title('Histogram of pixel intensities')

# Create the RangeSlider
slider_ax = plt.axes([0.20, 0.1, 0.60, 0.03])
slider = RangeSlider(slider_ax, "Threshold", img.min(), img.max())

# Create the Vertical lines on the histogram
lower_limit_line = axs[1].axvline(slider.val[0], color='k')
upper_limit_line = axs[1].axvline(slider.val[1], color='k')


def update(val):
    # The val passed to a callback by the RangeSlider will
    # be a tuple of (min, max)

    # Update the image's colormap
    im.norm.vmin = val[0]
    im.norm.vmax = val[1]

    # Update the position of the vertical lines
    lower_limit_line.set_xdata([val[0], val[0]])
    upper_limit_line.set_xdata([val[1], val[1]])

    # Redraw the figure to ensure it updates
    fig.canvas.draw_idle()


slider.on_changed(update)
plt.show()
References
The use of the following functions, methods, classes and modules is shown in this example:
Keywords: matplotlib code example, codex, python plot, pyplot Gallery generated by Sphinx-Gallery