Note
Click here to download the full example code
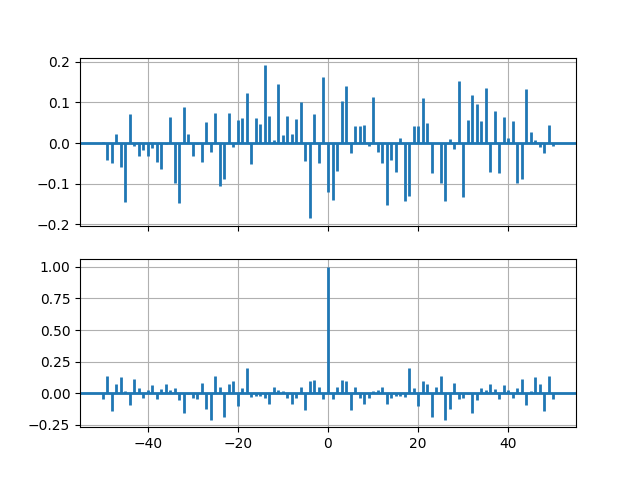
Cross- and Auto-Correlation Demo#
Example use of cross-correlation (xcorr) and auto-correlation
(acorr) plots.
import matplotlib.pyplot as plt
import numpy as np


# Fixing random state for reproducibility
np.random.seed(19680801)


x, y = np.random.randn(2, 100)
fig, [ax1, ax2] = plt.subplots(2, 1, sharex=True)
ax1.xcorr(x, y, usevlines=True, maxlags=50, normed=True, lw=2)
ax1.grid(True)

ax2.acorr(x, usevlines=True, normed=True, maxlags=50, lw=2)
ax2.grid(True)

plt.show()
References
The use of the following functions, methods, classes and modules is shown in this example:
Keywords: matplotlib code example, codex, python plot, pyplot Gallery generated by Sphinx-Gallery