Note
Click here to download the full example code
Labeling a pie and a donut#
Welcome to the Matplotlib bakery. We will create a pie and a donut
chart through the pie method and
show how to label them with a legend
as well as with annotations.
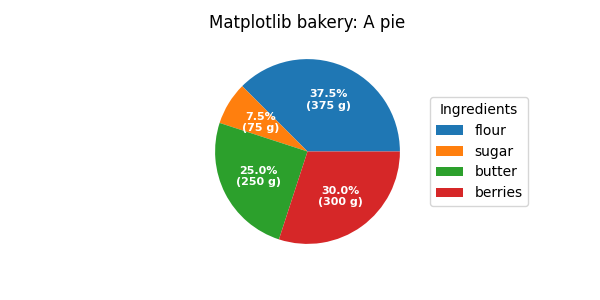
As usual we would start by defining the imports and create a figure with subplots. Now it's time for the pie. Starting with a pie recipe, we create the data and a list of labels from it.
We can provide a function to the autopct argument, which will expand
automatic percentage labeling by showing absolute values; we calculate
the latter back from relative data and the known sum of all values.
We then create the pie and store the returned objects for later. The first
returned element of the returned tuple is a list of the wedges. Those are
matplotlib.patches.Wedge patches, which can directly be used as the handles
for a legend. We can use the legend's bbox_to_anchor argument to position
the legend outside of the pie. Here we use the axes coordinates (1, 0, 0.5,
1) together with the location "center left"; i.e. the left central
point of the legend will be at the left central point of the bounding box,
spanning from (1, 0) to (1.5, 1) in axes coordinates.
import numpy as np
import matplotlib.pyplot as plt

fig, ax = plt.subplots(figsize=(6, 3), subplot_kw=dict(aspect="equal"))

recipe = ["375 g flour",
          "75 g sugar",
          "250 g butter",
          "300 g berries"]

data = [float(x.split()[0]) for x in recipe]
ingredients = [x.split()[-1] for x in recipe]


def func(pct, allvals):
    absolute = int(np.round(pct/100.*np.sum(allvals)))
    return "{:.1f}%\n({:d} g)".format(pct, absolute)


wedges, texts, autotexts = ax.pie(data, autopct=lambda pct: func(pct, data),
                                  textprops=dict(color="w"))

ax.legend(wedges, ingredients,
          title="Ingredients",
          loc="center left",
          bbox_to_anchor=(1, 0, 0.5, 1))

plt.setp(autotexts, size=8, weight="bold")

ax.set_title("Matplotlib bakery: A pie")

plt.show()
Now it's time for the donut. Starting with a donut recipe, we transcribe
the data to numbers (converting 1 egg to 50 g), and directly plot the pie.
The pie? Wait... it's going to be donut, is it not?
Well, as we see here, the donut is a pie, having a certain width set to
the wedges, which is different from its radius. It's as easy as it gets.
This is done via the wedgeprops argument.
We then want to label the wedges via
annotations. We first create some
dictionaries of common properties, which we can later pass as keyword
argument. We then iterate over all wedges and for each
calculate the angle of the wedge's center,
from that obtain the coordinates of the point at that angle on the circumference,
determine the horizontal alignment of the text, depending on which side of the circle the point lies,
update the connection style with the obtained angle to have the annotation arrow point outwards from the donut,
finally, create the annotation with all the previously determined parameters.
fig, ax = plt.subplots(figsize=(6, 3), subplot_kw=dict(aspect="equal"))

recipe = ["225 g flour",
          "90 g sugar",
          "1 egg",
          "60 g butter",
          "100 ml milk",
          "1/2 package of yeast"]

data = [225, 90, 50, 60, 100, 5]

wedges, texts = ax.pie(data, wedgeprops=dict(width=0.5), startangle=-40)

bbox_props = dict(boxstyle="square,pad=0.3", fc="w", ec="k", lw=0.72)
kw = dict(arrowprops=dict(arrowstyle="-"),
          bbox=bbox_props, zorder=0, va="center")

for i, p in enumerate(wedges):
    ang = (p.theta2 - p.theta1)/2. + p.theta1
    y = np.sin(np.deg2rad(ang))
    x = np.cos(np.deg2rad(ang))
    horizontalalignment = {-1: "right", 1: "left"}[int(np.sign(x))]
    connectionstyle = "angle,angleA=0,angleB={}".format(ang)
    kw["arrowprops"].update({"connectionstyle": connectionstyle})
    ax.annotate(recipe[i], xy=(x, y), xytext=(1.35*np.sign(x), 1.4*y),
                horizontalalignment=horizontalalignment, **kw)

ax.set_title("Matplotlib bakery: A donut")

plt.show()
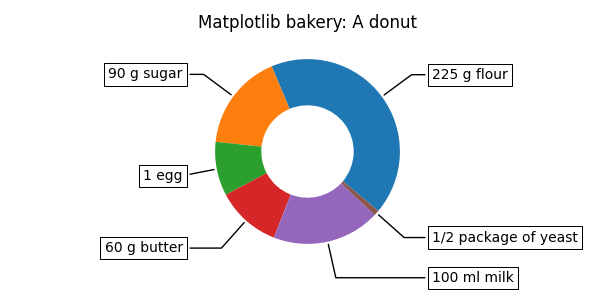
And here it is, the donut. Note however, that if we were to use this recipe, the ingredients would suffice for around 6 donuts - producing one huge donut is untested and might result in kitchen errors.
References
The use of the following functions, methods, classes and modules is shown in this example:
Keywords: matplotlib code example, codex, python plot, pyplot Gallery generated by Sphinx-Gallery