Note
Click here to download the full example code
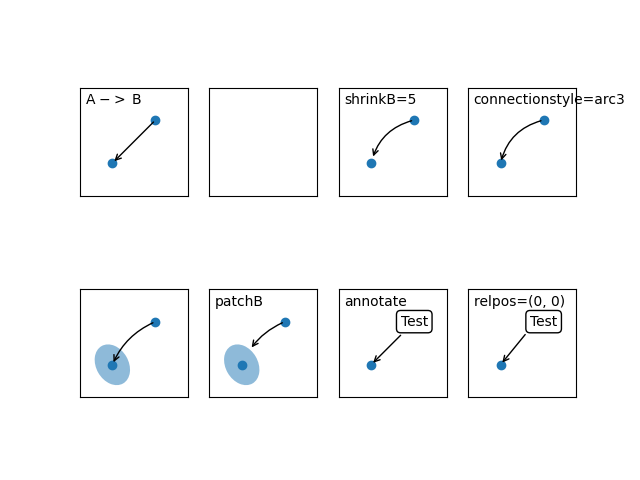
Simple Annotate01#
import matplotlib.pyplot as plt
import matplotlib.patches as mpatches


fig, axs = plt.subplots(2, 4)
x1, y1 = 0.3, 0.3
x2, y2 = 0.7, 0.7

ax = axs.flat[0]
ax.plot([x1, x2], [y1, y2], "o")
ax.annotate("",
            xy=(x1, y1), xycoords='data',
            xytext=(x2, y2), textcoords='data',
            arrowprops=dict(arrowstyle="->"))
ax.text(.05, .95, "A $->$ B",
        transform=ax.transAxes, ha="left", va="top")

ax = axs.flat[2]
ax.plot([x1, x2], [y1, y2], "o")
ax.annotate("",
            xy=(x1, y1), xycoords='data',
            xytext=(x2, y2), textcoords='data',
            arrowprops=dict(arrowstyle="->", connectionstyle="arc3,rad=0.3",
                            shrinkB=5))
ax.text(.05, .95, "shrinkB=5",
        transform=ax.transAxes, ha="left", va="top")

ax = axs.flat[3]
ax.plot([x1, x2], [y1, y2], "o")
ax.annotate("",
            xy=(x1, y1), xycoords='data',
            xytext=(x2, y2), textcoords='data',
            arrowprops=dict(arrowstyle="->", connectionstyle="arc3,rad=0.3"))
ax.text(.05, .95, "connectionstyle=arc3",
        transform=ax.transAxes, ha="left", va="top")

ax = axs.flat[4]
ax.plot([x1, x2], [y1, y2], "o")
el = mpatches.Ellipse((x1, y1), 0.3, 0.4, angle=30, alpha=0.5)
ax.add_artist(el)
ax.annotate("",
            xy=(x1, y1), xycoords='data',
            xytext=(x2, y2), textcoords='data',
            arrowprops=dict(arrowstyle="->", connectionstyle="arc3,rad=0.2"))

ax = axs.flat[5]
ax.plot([x1, x2], [y1, y2], "o")
el = mpatches.Ellipse((x1, y1), 0.3, 0.4, angle=30, alpha=0.5)
ax.add_artist(el)
ax.annotate("",
            xy=(x1, y1), xycoords='data',
            xytext=(x2, y2), textcoords='data',
            arrowprops=dict(arrowstyle="->", connectionstyle="arc3,rad=0.2",
                            patchB=el))
ax.text(.05, .95, "patchB",
        transform=ax.transAxes, ha="left", va="top")

ax = axs.flat[6]
ax.plot([x1], [y1], "o")
ax.annotate("Test",
            xy=(x1, y1), xycoords='data',
            xytext=(x2, y2), textcoords='data',
            ha="center", va="center",
            bbox=dict(boxstyle="round", fc="w"),
            arrowprops=dict(arrowstyle="->"))
ax.text(.05, .95, "annotate",
        transform=ax.transAxes, ha="left", va="top")

ax = axs.flat[7]
ax.plot([x1], [y1], "o")
ax.annotate("Test",
            xy=(x1, y1), xycoords='data',
            xytext=(x2, y2), textcoords='data',
            ha="center", va="center",
            bbox=dict(boxstyle="round", fc="w", ),
            arrowprops=dict(arrowstyle="->", relpos=(0., 0.)))
ax.text(.05, .95, "relpos=(0, 0)",
        transform=ax.transAxes, ha="left", va="top")

for ax in axs.flat:
    ax.set(xlim=(0, 1), ylim=(0, 1), xticks=[], yticks=[], aspect=1)

plt.show()
Keywords: matplotlib code example, codex, python plot, pyplot Gallery generated by Sphinx-Gallery