Note
Click here to download the full example code
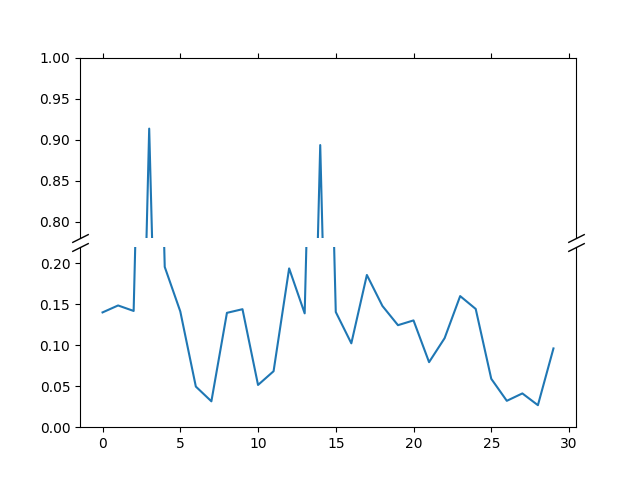
Broken Axis#
Broken axis example, where the y-axis will have a portion cut out.
import numpy as np
import matplotlib.pyplot as plt

np.random.seed(19680801)

pts = np.random.rand(30)*.2
# Now let's make two outlier points which are far away from everything.
pts[[3, 14]] += .8

# If we were to simply plot pts, we'd lose most of the interesting
# details due to the outliers. So let's 'break' or 'cut-out' the y-axis
# into two portions - use the top (ax1) for the outliers, and the bottom
# (ax2) for the details of the majority of our data
fig, (ax1, ax2) = plt.subplots(2, 1, sharex=True)
fig.subplots_adjust(hspace=0.05)  # adjust space between axes

# plot the same data on both axes
ax1.plot(pts)
ax2.plot(pts)

# zoom-in / limit the view to different portions of the data
ax1.set_ylim(.78, 1.)  # outliers only
ax2.set_ylim(0, .22)  # most of the data

# hide the spines between ax and ax2
ax1.spines.bottom.set_visible(False)
ax2.spines.top.set_visible(False)
ax1.xaxis.tick_top()
ax1.tick_params(labeltop=False)  # don't put tick labels at the top
ax2.xaxis.tick_bottom()

# Now, let's turn towards the cut-out slanted lines.
# We create line objects in axes coordinates, in which (0,0), (0,1),
# (1,0), and (1,1) are the four corners of the axes.
# The slanted lines themselves are markers at those locations, such that the
# lines keep their angle and position, independent of the axes size or scale
# Finally, we need to disable clipping.

d = .5  # proportion of vertical to horizontal extent of the slanted line
kwargs = dict(marker=[(-1, -d), (1, d)], markersize=12,
              linestyle="none", color='k', mec='k', mew=1, clip_on=False)
ax1.plot([0, 1], [0, 0], transform=ax1.transAxes, **kwargs)
ax2.plot([0, 1], [1, 1], transform=ax2.transAxes, **kwargs)


plt.show()
Keywords: matplotlib code example, codex, python plot, pyplot Gallery generated by Sphinx-Gallery