Note
Click here to download the full example code
Loglog Aspect#
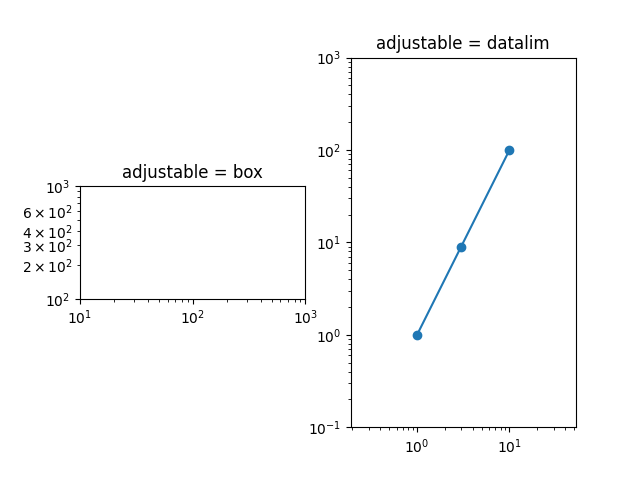
import matplotlib.pyplot as plt

fig, (ax1, ax2) = plt.subplots(1, 2)
ax1.set_xscale("log")
ax1.set_yscale("log")
ax1.set_xlim(1e1, 1e3)
ax1.set_ylim(1e2, 1e3)
ax1.set_aspect(1)
ax1.set_title("adjustable = box")

ax2.set_xscale("log")
ax2.set_yscale("log")
ax2.set_adjustable("datalim")
ax2.plot([1, 3, 10], [1, 9, 100], "o-")
ax2.set_xlim(1e-1, 1e2)
ax2.set_ylim(1e-1, 1e3)
ax2.set_aspect(1)
ax2.set_title("adjustable = datalim")

plt.show()
Keywords: matplotlib code example, codex, python plot, pyplot Gallery generated by Sphinx-Gallery