Note
Click here to download the full example code
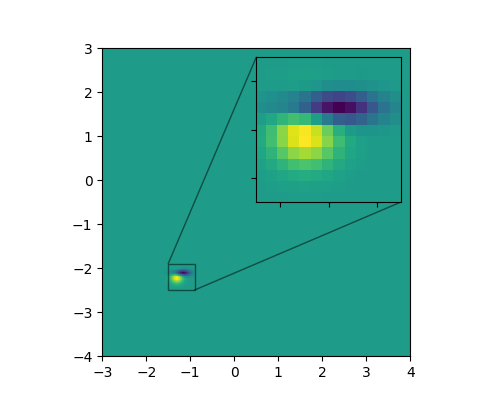
Zoom region inset axes#
Example of an inset axes and a rectangle showing where the zoom is located.
from matplotlib import cbook
import matplotlib.pyplot as plt
import numpy as np


def get_demo_image():
    z = cbook.get_sample_data("axes_grid/bivariate_normal.npy", np_load=True)
    # z is a numpy array of 15x15
    return z, (-3, 4, -4, 3)

fig, ax = plt.subplots(figsize=[5, 4])

# make data
Z, extent = get_demo_image()
Z2 = np.zeros((150, 150))
ny, nx = Z.shape
Z2[30:30+ny, 30:30+nx] = Z

ax.imshow(Z2, extent=extent, origin="lower")

# inset axes....
axins = ax.inset_axes([0.5, 0.5, 0.47, 0.47])
axins.imshow(Z2, extent=extent, origin="lower")
# sub region of the original image
x1, x2, y1, y2 = -1.5, -0.9, -2.5, -1.9
axins.set_xlim(x1, x2)
axins.set_ylim(y1, y2)
axins.set_xticklabels([])
axins.set_yticklabels([])

ax.indicate_inset_zoom(axins, edgecolor="black")

plt.show()
References
The use of the following functions, methods, classes and modules is shown in this example:
Keywords: matplotlib code example, codex, python plot, pyplot Gallery generated by Sphinx-Gallery