Note
Click here to download the full example code
Simple Axes Divider 1#
See also Overview of mpl_toolkits.axes_grid1.
from mpl_toolkits.axes_grid1 import Size, Divider
import matplotlib.pyplot as plt


def label_axes(ax, text):
    """Place a label at the center of an axes, and remove the axis ticks."""
    ax.text(.5, .5, text, transform=ax.transAxes,
            horizontalalignment="center", verticalalignment="center")
    ax.tick_params(bottom=False, labelbottom=False,
                   left=False, labelleft=False)
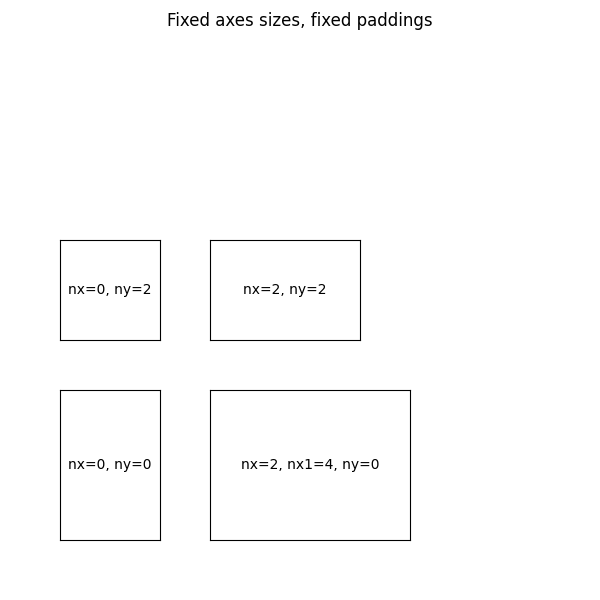
Fixed axes sizes; fixed paddings.
fig = plt.figure(figsize=(6, 6))
fig.suptitle("Fixed axes sizes, fixed paddings")

# Sizes are in inches.
horiz = [Size.Fixed(1.), Size.Fixed(.5), Size.Fixed(1.5), Size.Fixed(.5)]
vert = [Size.Fixed(1.5), Size.Fixed(.5), Size.Fixed(1.)]

rect = (0.1, 0.1, 0.8, 0.8)
# Divide the axes rectangle into a grid with sizes specified by horiz * vert.
div = Divider(fig, rect, horiz, vert, aspect=False)

# The rect parameter will actually be ignored and overridden by axes_locator.
ax1 = fig.add_axes(rect, axes_locator=div.new_locator(nx=0, ny=0))
label_axes(ax1, "nx=0, ny=0")
ax2 = fig.add_axes(rect, axes_locator=div.new_locator(nx=0, ny=2))
label_axes(ax2, "nx=0, ny=2")
ax3 = fig.add_axes(rect, axes_locator=div.new_locator(nx=2, ny=2))
label_axes(ax3, "nx=2, ny=2")
ax4 = fig.add_axes(rect, axes_locator=div.new_locator(nx=2, nx1=4, ny=0))
label_axes(ax4, "nx=2, nx1=4, ny=0")
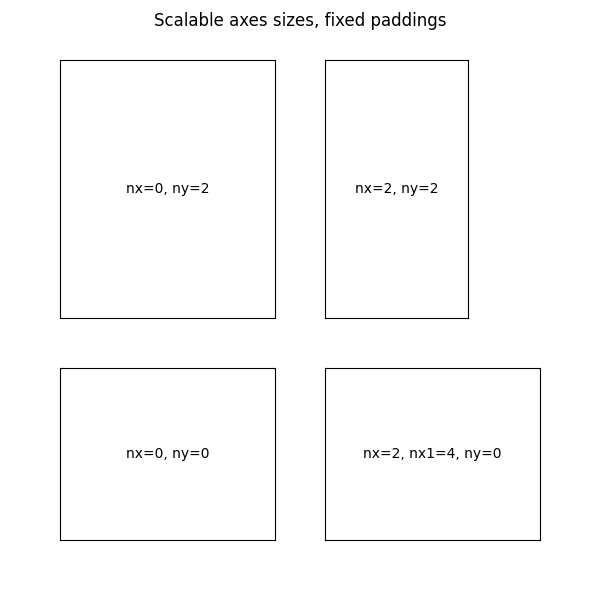
Axes sizes that scale with the figure size; fixed paddings.
fig = plt.figure(figsize=(6, 6))
fig.suptitle("Scalable axes sizes, fixed paddings")

horiz = [Size.Scaled(1.5), Size.Fixed(.5), Size.Scaled(1.), Size.Scaled(.5)]
vert = [Size.Scaled(1.), Size.Fixed(.5), Size.Scaled(1.5)]

rect = (0.1, 0.1, 0.8, 0.8)
# Divide the axes rectangle into a grid with sizes specified by horiz * vert.
div = Divider(fig, rect, horiz, vert, aspect=False)

# The rect parameter will actually be ignored and overridden by axes_locator.
ax1 = fig.add_axes(rect, axes_locator=div.new_locator(nx=0, ny=0))
label_axes(ax1, "nx=0, ny=0")
ax2 = fig.add_axes(rect, axes_locator=div.new_locator(nx=0, ny=2))
label_axes(ax2, "nx=0, ny=2")
ax3 = fig.add_axes(rect, axes_locator=div.new_locator(nx=2, ny=2))
label_axes(ax3, "nx=2, ny=2")
ax4 = fig.add_axes(rect, axes_locator=div.new_locator(nx=2, nx1=4, ny=0))
label_axes(ax4, "nx=2, nx1=4, ny=0")

plt.show()
Keywords: matplotlib code example, codex, python plot, pyplot Gallery generated by Sphinx-Gallery