Note
Click here to download the full example code
Automatically setting tick positions#
Setting the behavior of tick auto-placement.
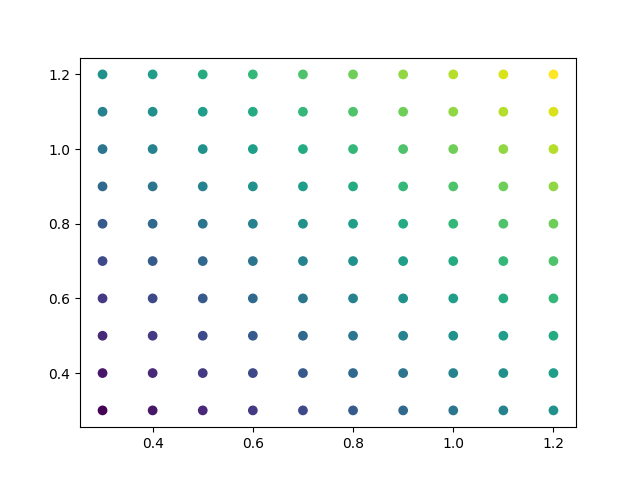
By default, Matplotlib will choose the number of ticks and tick positions so that there is a reasonable number of ticks on the axis and they are located at "round" numbers.
As a result, there may be no ticks on the edges of the plot.
import matplotlib.pyplot as plt
import numpy as np
np.random.seed(19680801)

fig, ax = plt.subplots()
dots = np.linspace(0.3, 1.2, 10)
X, Y = np.meshgrid(dots, dots)
x, y = X.ravel(), Y.ravel()
ax.scatter(x, y, c=x+y)
plt.show()
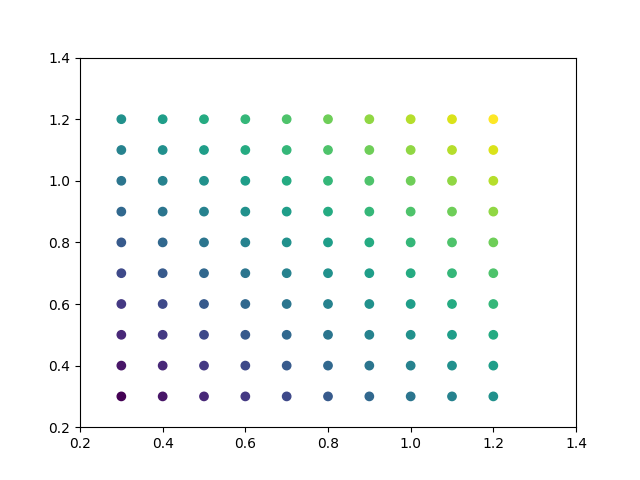
If you want to keep ticks at round numbers, and also have ticks at the edges
you can switch rcParams["axes.autolimit_mode"] (default: 'data') to 'round_numbers'. This expands the
axis limits to the next round number.
plt.rcParams['axes.autolimit_mode'] = 'round_numbers'

# Note: The limits are calculated at draw-time. Therefore, when using
# :rc:`axes.autolimit_mode` in a context manager, it is important that
# the ``show()`` command is within the context.

fig, ax = plt.subplots()
ax.scatter(x, y, c=x+y)
plt.show()
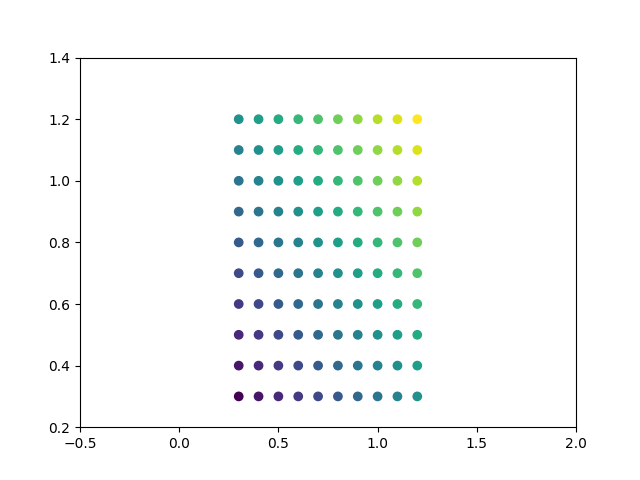
The round numbers autolimit_mode is still respected if you set an additional
margin around the data using Axes.set_xmargin / Axes.set_ymargin:
fig, ax = plt.subplots()
ax.scatter(x, y, c=x+y)
ax.set_xmargin(0.8)
plt.show()
Total running time of the script: ( 0 minutes 1.069 seconds)
Keywords: matplotlib code example, codex, python plot, pyplot Gallery generated by Sphinx-Gallery