Note
Click here to download the full example code
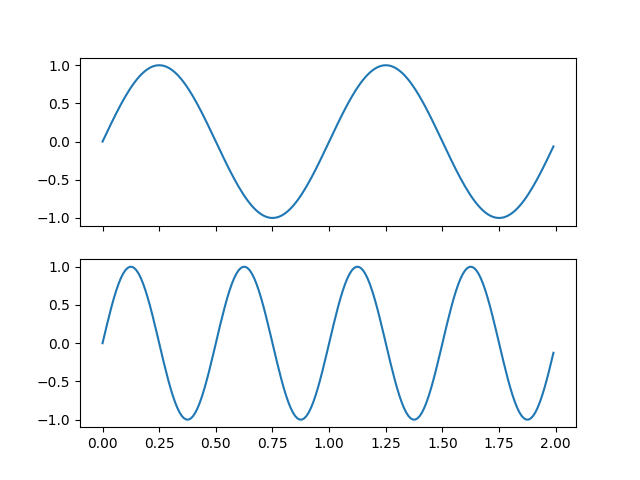
Multicursor#
Showing a cursor on multiple plots simultaneously.
This example generates two subplots and on hovering the cursor over data in one subplot, the values of that datapoint are shown in both respectively.
import numpy as np
import matplotlib.pyplot as plt
from matplotlib.widgets import MultiCursor

t = np.arange(0.0, 2.0, 0.01)
s1 = np.sin(2*np.pi*t)
s2 = np.sin(4*np.pi*t)

fig, (ax1, ax2) = plt.subplots(2, sharex=True)
ax1.plot(t, s1)
ax2.plot(t, s2)

multi = MultiCursor(fig.canvas, (ax1, ax2), color='r', lw=1)
plt.show()
References
The use of the following functions, methods, classes and modules is shown in this example:
Keywords: matplotlib code example, codex, python plot, pyplot Gallery generated by Sphinx-Gallery