Note
Click here to download the full example code
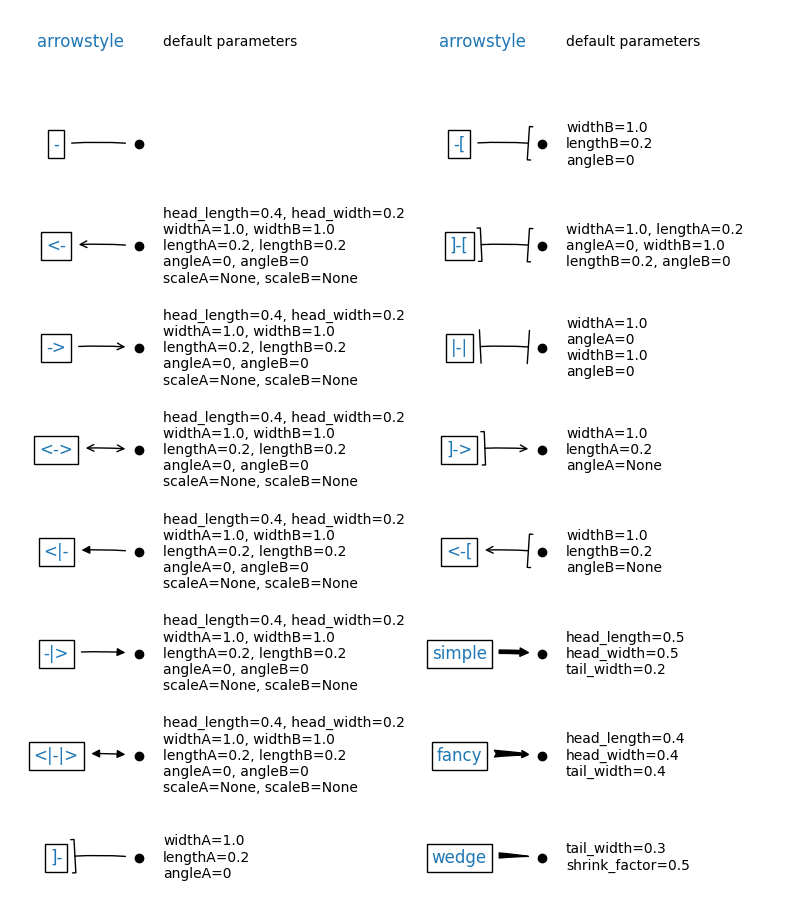
Annotation arrow style reference#
Overview of the arrow styles available in annotate.
import inspect
import re
import itertools

import matplotlib.patches as mpatches
import matplotlib.pyplot as plt

styles = mpatches.ArrowStyle.get_styles()
ncol = 2
nrow = (len(styles) + 1) // ncol
axs = (plt.figure(figsize=(4 * ncol, 1 + nrow))
       .add_gridspec(1 + nrow, ncol,
                     wspace=.7, left=.1, right=.9, bottom=0, top=1).subplots())
for ax in axs.flat:
    ax.set_axis_off()
for ax in axs[0, :]:
    ax.text(0, .5, "arrowstyle",
            transform=ax.transAxes, size="large", color="tab:blue",
            horizontalalignment="center", verticalalignment="center")
    ax.text(.35, .5, "default parameters",
            transform=ax.transAxes,
            horizontalalignment="left", verticalalignment="center")
for ax, (stylename, stylecls) in zip(axs[1:, :].T.flat, styles.items()):
    l, = ax.plot(.25, .5, "ok", transform=ax.transAxes)
    ax.annotate(stylename, (.25, .5), (-0.1, .5),
                xycoords="axes fraction", textcoords="axes fraction",
                size="large", color="tab:blue",
                horizontalalignment="center", verticalalignment="center",
                arrowprops=dict(
                    arrowstyle=stylename, connectionstyle="arc3,rad=-0.05",
                    color="k", shrinkA=5, shrinkB=5, patchB=l,
                ),
                bbox=dict(boxstyle="square", fc="w"))
    # wrap at every nth comma (n = 1 or 2, depending on text length)
    s = str(inspect.signature(stylecls))[1:-1]
    n = 2 if s.count(',') > 3 else 1
    ax.text(.35, .5,
            re.sub(', ', lambda m, c=itertools.count(1): m.group()
                   if next(c) % n else '\n', s),
            transform=ax.transAxes,
            horizontalalignment="left", verticalalignment="center")

plt.show()
References
The use of the following functions, methods, classes and modules is shown in this example:
matplotlib.patches.ArrowStyle.get_styles
Total running time of the script: ( 0 minutes 1.412 seconds)
Keywords: matplotlib code example, codex, python plot, pyplot Gallery generated by Sphinx-Gallery