Note
Click here to download the full example code
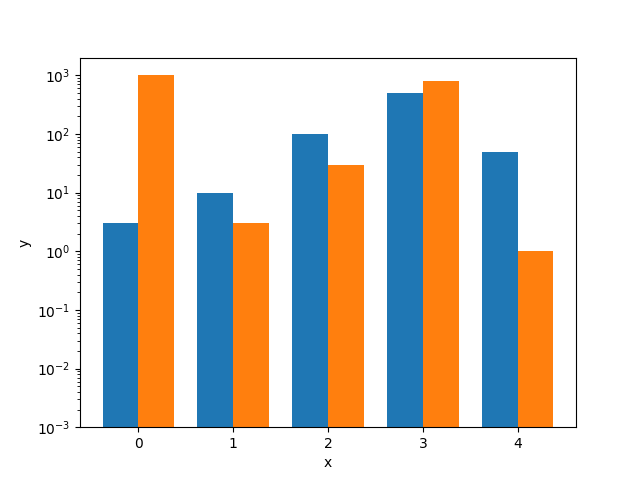
Log Bar#
Plotting a bar chart with a logarithmic y-axis.
import matplotlib.pyplot as plt
import numpy as np

data = ((3, 1000), (10, 3), (100, 30), (500, 800), (50, 1))

dim = len(data[0])
w = 0.75
dimw = w / dim

fig, ax = plt.subplots()
x = np.arange(len(data))
for i in range(len(data[0])):
    y = [d[i] for d in data]
    b = ax.bar(x + i * dimw, y, dimw, bottom=0.001)

ax.set_xticks(x + dimw / 2, labels=map(str, x))
ax.set_yscale('log')

ax.set_xlabel('x')
ax.set_ylabel('y')

plt.show()
Keywords: matplotlib code example, codex, python plot, pyplot Gallery generated by Sphinx-Gallery