Note
Click here to download the full example code
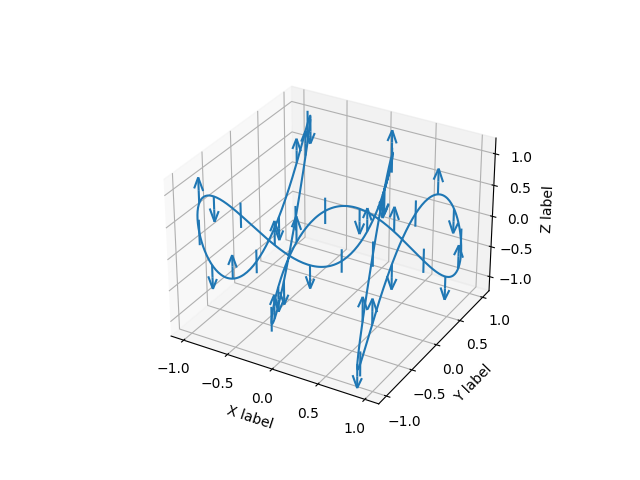
3D errorbars#
An example of using errorbars with upper and lower limits in mplot3d.
import matplotlib.pyplot as plt
import numpy as np

ax = plt.figure().add_subplot(projection='3d')

# setting up a parametric curve
t = np.arange(0, 2*np.pi+.1, 0.01)
x, y, z = np.sin(t), np.cos(3*t), np.sin(5*t)

estep = 15
i = np.arange(t.size)
zuplims = (i % estep == 0) & (i // estep % 3 == 0)
zlolims = (i % estep == 0) & (i // estep % 3 == 2)

ax.errorbar(x, y, z, 0.2, zuplims=zuplims, zlolims=zlolims, errorevery=estep)

ax.set_xlabel("X label")
ax.set_ylabel("Y label")
ax.set_zlabel("Z label")

plt.show()
Keywords: matplotlib code example, codex, python plot, pyplot Gallery generated by Sphinx-Gallery