Note
Click here to download the full example code
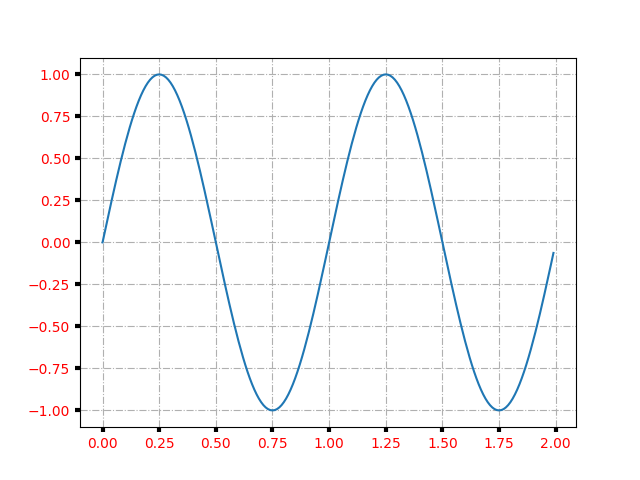
Axes Props#
You can control the axis tick and grid properties
Keywords: matplotlib code example, codex, python plot, pyplot Gallery generated by Sphinx-Gallery
Note
Click here to download the full example code
You can control the axis tick and grid properties
Keywords: matplotlib code example, codex, python plot, pyplot Gallery generated by Sphinx-Gallery