Note
Click here to download the full example code
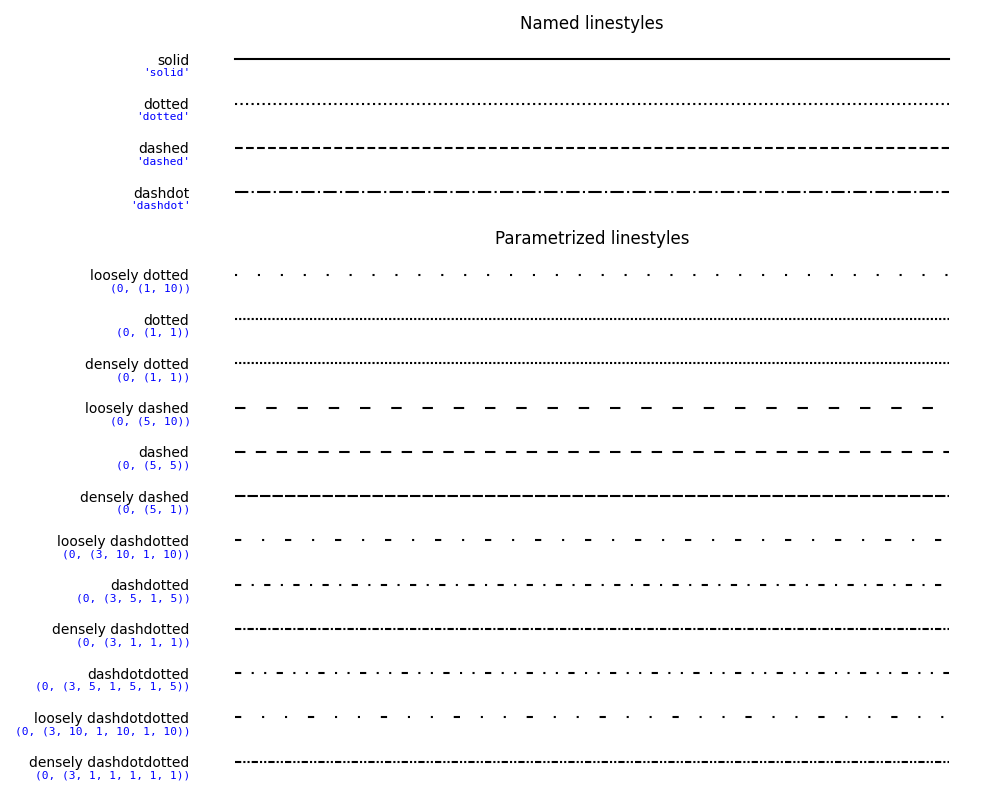
Linestyles#
Simple linestyles can be defined using the strings "solid", "dotted", "dashed"
or "dashdot". More refined control can be achieved by providing a dash tuple
(offset, (on_off_seq)). For example, (0, (3, 10, 1, 15)) means
(3pt line, 10pt space, 1pt line, 15pt space) with no offset. See also
Line2D.set_linestyle.
Note: The dash style can also be configured via Line2D.set_dashes
as shown in Customizing dashed line styles
and passing a list of dash sequences using the keyword dashes to the
cycler in property_cycle.
import numpy as np
import matplotlib.pyplot as plt

linestyle_str = [
     ('solid', 'solid'),      # Same as (0, ()) or '-'
     ('dotted', 'dotted'),    # Same as (0, (1, 1)) or ':'
     ('dashed', 'dashed'),    # Same as '--'
     ('dashdot', 'dashdot')]  # Same as '-.'

linestyle_tuple = [
     ('loosely dotted',        (0, (1, 10))),
     ('dotted',                (0, (1, 1))),
     ('densely dotted',        (0, (1, 1))),

     ('loosely dashed',        (0, (5, 10))),
     ('dashed',                (0, (5, 5))),
     ('densely dashed',        (0, (5, 1))),

     ('loosely dashdotted',    (0, (3, 10, 1, 10))),
     ('dashdotted',            (0, (3, 5, 1, 5))),
     ('densely dashdotted',    (0, (3, 1, 1, 1))),

     ('dashdotdotted',         (0, (3, 5, 1, 5, 1, 5))),
     ('loosely dashdotdotted', (0, (3, 10, 1, 10, 1, 10))),
     ('densely dashdotdotted', (0, (3, 1, 1, 1, 1, 1)))]


def plot_linestyles(ax, linestyles, title):
    X, Y = np.linspace(0, 100, 10), np.zeros(10)
    yticklabels = []

    for i, (name, linestyle) in enumerate(linestyles):
        ax.plot(X, Y+i, linestyle=linestyle, linewidth=1.5, color='black')
        yticklabels.append(name)

    ax.set_title(title)
    ax.set(ylim=(-0.5, len(linestyles)-0.5),
           yticks=np.arange(len(linestyles)),
           yticklabels=yticklabels)
    ax.tick_params(left=False, bottom=False, labelbottom=False)
    ax.spines[:].set_visible(False)

    # For each line style, add a text annotation with a small offset from
    # the reference point (0 in Axes coords, y tick value in Data coords).
    for i, (name, linestyle) in enumerate(linestyles):
        ax.annotate(repr(linestyle),
                    xy=(0.0, i), xycoords=ax.get_yaxis_transform(),
                    xytext=(-6, -12), textcoords='offset points',
                    color="blue", fontsize=8, ha="right", family="monospace")


ax0, ax1 = (plt.figure(figsize=(10, 8))
            .add_gridspec(2, 1, height_ratios=[1, 3])
            .subplots())

plot_linestyles(ax0, linestyle_str[::-1], title='Named linestyles')
plot_linestyles(ax1, linestyle_tuple[::-1], title='Parametrized linestyles')

plt.tight_layout()
plt.show()
Keywords: matplotlib code example, codex, python plot, pyplot Gallery generated by Sphinx-Gallery