Note
Click here to download the full example code
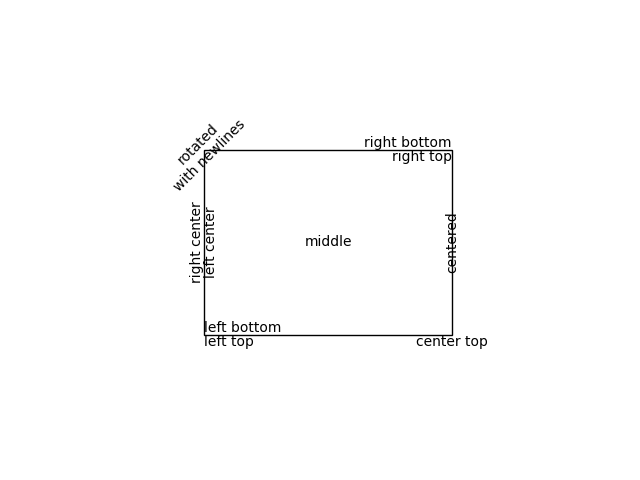
Precise text layout#
You can precisely layout text in data or axes coordinates. This example shows you some of the alignment and rotation specifications for text layout.
import matplotlib.pyplot as plt

fig, ax = plt.subplots()

# Build a rectangle in axes coords
left, width = .25, .5
bottom, height = .25, .5
right = left + width
top = bottom + height
p = plt.Rectangle((left, bottom), width, height, fill=False)
p.set_transform(ax.transAxes)
p.set_clip_on(False)
ax.add_patch(p)

ax.text(left, bottom, 'left top',
        horizontalalignment='left',
        verticalalignment='top',
        transform=ax.transAxes)

ax.text(left, bottom, 'left bottom',
        horizontalalignment='left',
        verticalalignment='bottom',
        transform=ax.transAxes)

ax.text(right, top, 'right bottom',
        horizontalalignment='right',
        verticalalignment='bottom',
        transform=ax.transAxes)

ax.text(right, top, 'right top',
        horizontalalignment='right',
        verticalalignment='top',
        transform=ax.transAxes)

ax.text(right, bottom, 'center top',
        horizontalalignment='center',
        verticalalignment='top',
        transform=ax.transAxes)

ax.text(left, 0.5 * (bottom + top), 'right center',
        horizontalalignment='right',
        verticalalignment='center',
        rotation='vertical',
        transform=ax.transAxes)

ax.text(left, 0.5 * (bottom + top), 'left center',
        horizontalalignment='left',
        verticalalignment='center',
        rotation='vertical',
        transform=ax.transAxes)

ax.text(0.5 * (left + right), 0.5 * (bottom + top), 'middle',
        horizontalalignment='center',
        verticalalignment='center',
        transform=ax.transAxes)

ax.text(right, 0.5 * (bottom + top), 'centered',
        horizontalalignment='center',
        verticalalignment='center',
        rotation='vertical',
        transform=ax.transAxes)

ax.text(left, top, 'rotated\nwith newlines',
        horizontalalignment='center',
        verticalalignment='center',
        rotation=45,
        transform=ax.transAxes)

ax.set_axis_off()

plt.show()
Keywords: matplotlib code example, codex, python plot, pyplot Gallery generated by Sphinx-Gallery