Note
Click here to download the full example code
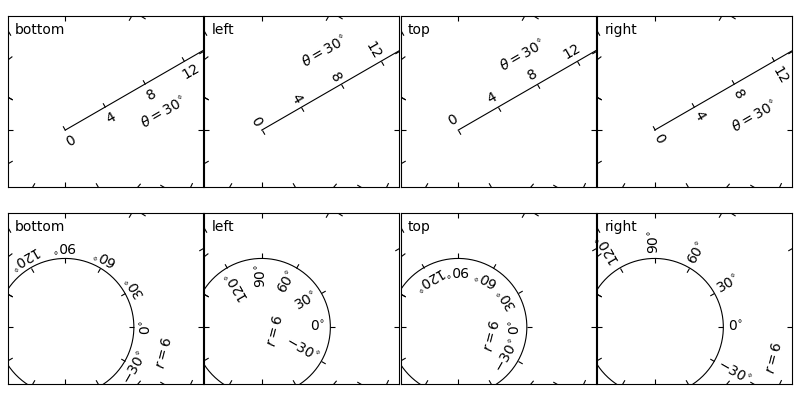
axis_direction demo#
import numpy as np
import matplotlib.pyplot as plt
import mpl_toolkits.axisartist.angle_helper as angle_helper
import mpl_toolkits.axisartist.grid_finder as grid_finder
from matplotlib.projections import PolarAxes
from matplotlib.transforms import Affine2D

import mpl_toolkits.axisartist as axisartist

from mpl_toolkits.axisartist.grid_helper_curvelinear import \
    GridHelperCurveLinear


def setup_axes(fig, rect):
    """Polar projection, but in a rectangular box."""

    # see demo_curvelinear_grid.py for details
    tr = Affine2D().scale(np.pi/180., 1.) + PolarAxes.PolarTransform()

    extreme_finder = angle_helper.ExtremeFinderCycle(20, 20,
                                                     lon_cycle=360,
                                                     lat_cycle=None,
                                                     lon_minmax=None,
                                                     lat_minmax=(0, np.inf),
                                                     )

    grid_locator1 = angle_helper.LocatorDMS(12)
    grid_locator2 = grid_finder.MaxNLocator(5)

    tick_formatter1 = angle_helper.FormatterDMS()

    grid_helper = GridHelperCurveLinear(tr,
                                        extreme_finder=extreme_finder,
                                        grid_locator1=grid_locator1,
                                        grid_locator2=grid_locator2,
                                        tick_formatter1=tick_formatter1
                                        )

    ax1 = fig.add_subplot(
        rect, axes_class=axisartist.Axes, grid_helper=grid_helper)
    ax1.axis[:].toggle(ticklabels=False)

    ax1.set_aspect(1.)
    ax1.set_xlim(-5, 12)
    ax1.set_ylim(-5, 10)

    return ax1


def add_floating_axis1(ax1):
    ax1.axis["lat"] = axis = ax1.new_floating_axis(0, 30)
    axis.label.set_text(r"$\theta = 30^{\circ}$")
    axis.label.set_visible(True)

    return axis


def add_floating_axis2(ax1):
    ax1.axis["lon"] = axis = ax1.new_floating_axis(1, 6)
    axis.label.set_text(r"$r = 6$")
    axis.label.set_visible(True)

    return axis


fig = plt.figure(figsize=(8, 4))
fig.subplots_adjust(left=0.01, right=0.99, bottom=0.01, top=0.99,
                    wspace=0.01, hspace=0.01)

for i, d in enumerate(["bottom", "left", "top", "right"]):
    ax1 = setup_axes(fig, rect=241++i)
    axis = add_floating_axis1(ax1)
    axis.set_axis_direction(d)
    ax1.annotate(d, (0, 1), (5, -5),
                 xycoords="axes fraction", textcoords="offset points",
                 va="top", ha="left")

for i, d in enumerate(["bottom", "left", "top", "right"]):
    ax1 = setup_axes(fig, rect=245++i)
    axis = add_floating_axis2(ax1)
    axis.set_axis_direction(d)
    ax1.annotate(d, (0, 1), (5, -5),
                 xycoords="axes fraction", textcoords="offset points",
                 va="top", ha="left")

plt.show()
Keywords: matplotlib code example, codex, python plot, pyplot Gallery generated by Sphinx-Gallery