Note
Click here to download the full example code
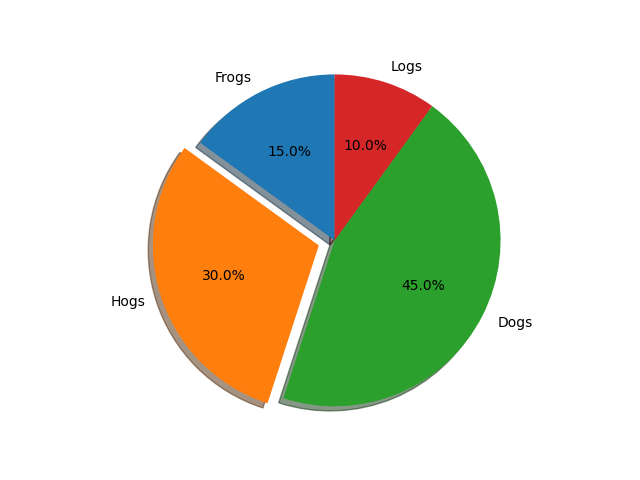
Basic pie chart#
Demo of a basic pie chart plus a few additional features.
In addition to the basic pie chart, this demo shows a few optional features:
slice labels
auto-labeling the percentage
offsetting a slice with "explode"
drop-shadow
custom start angle
Note about the custom start angle:
The default startangle is 0, which would start the "Frogs" slice on the
positive x-axis. This example sets startangle = 90 such that everything is
rotated counter-clockwise by 90 degrees, and the frog slice starts on the
positive y-axis.
import matplotlib.pyplot as plt

# Pie chart, where the slices will be ordered and plotted counter-clockwise:
labels = 'Frogs', 'Hogs', 'Dogs', 'Logs'
sizes = [15, 30, 45, 10]
explode = (0, 0.1, 0, 0)  # only "explode" the 2nd slice (i.e. 'Hogs')

fig1, ax1 = plt.subplots()
ax1.pie(sizes, explode=explode, labels=labels, autopct='%1.1f%%',
        shadow=True, startangle=90)
ax1.axis('equal')  # Equal aspect ratio ensures that pie is drawn as a circle.

plt.show()
References
The use of the following functions, methods, classes and modules is shown in this example:
Keywords: matplotlib code example, codex, python plot, pyplot Gallery generated by Sphinx-Gallery