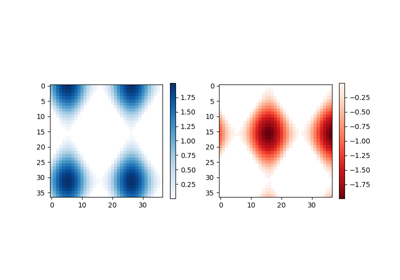
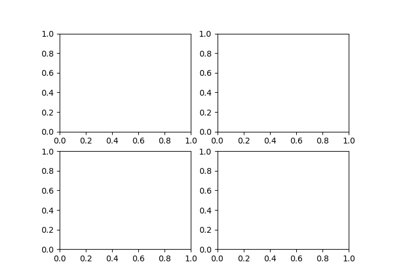
matplotlib.pyplot.subplots(nrows=1, ncols=1, sharex=False, sharey=False, squeeze=True, subplot_kw=None, gridspec_kw=None, **fig_kw)¶Create a figure and a set of subplots
This utility wrapper makes it convenient to create common layouts of subplots, including the enclosing figure object, in a single call.
| Parameters: | nrows, ncols : int, optional, default: 1
sharex, sharey : bool or {‘none’, ‘all’, ‘row’, ‘col’}, default: False
squeeze : bool, optional, default: True
subplot_kw : dict, optional
gridspec_kw : dict, optional
**fig_kw :
|
|---|---|
| Returns: | fig : ax : Axes object or array of Axes objects.
|
Examples
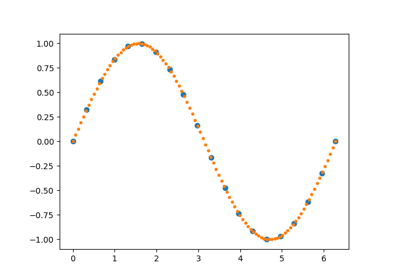
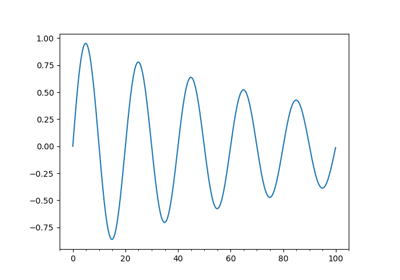
First create some toy data:
>>> x = np.linspace(0, 2*np.pi, 400)
>>> y = np.sin(x**2)
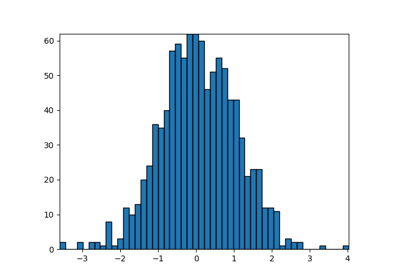
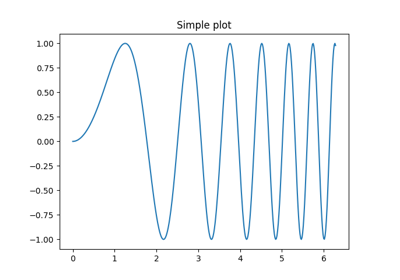
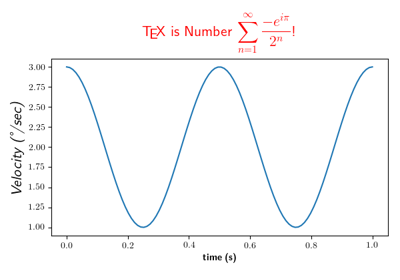
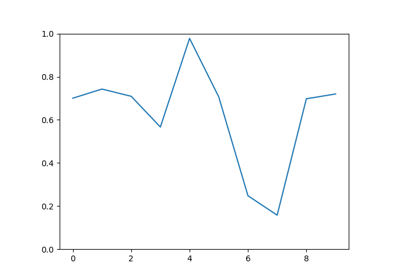
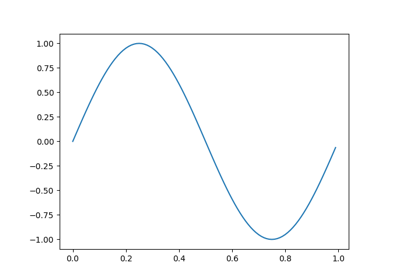
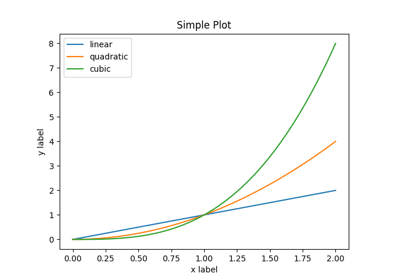
Creates just a figure and only one subplot
>>> fig, ax = plt.subplots()
>>> ax.plot(x, y)
>>> ax.set_title('Simple plot')
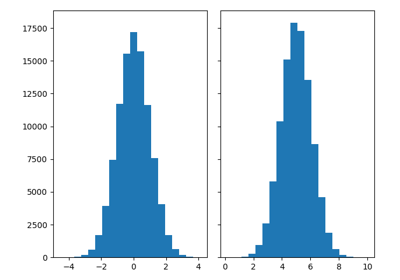
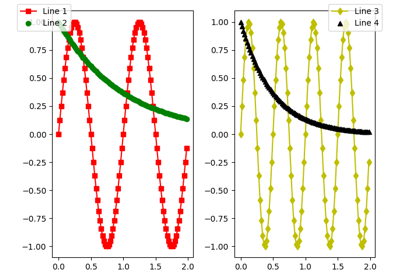
Creates two subplots and unpacks the output array immediately
>>> f, (ax1, ax2) = plt.subplots(1, 2, sharey=True)
>>> ax1.plot(x, y)
>>> ax1.set_title('Sharing Y axis')
>>> ax2.scatter(x, y)
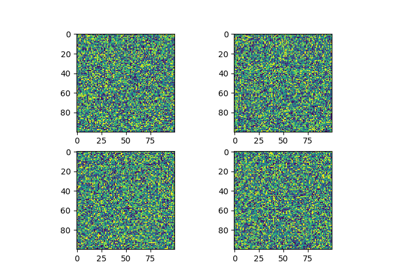
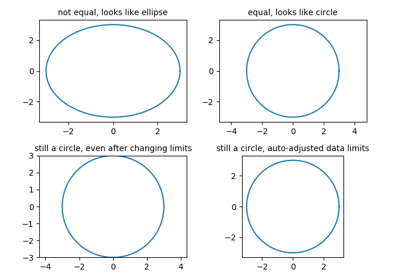
Creates four polar axes, and accesses them through the returned array
>>> fig, axes = plt.subplots(2, 2, subplot_kw=dict(polar=True))
>>> axes[0, 0].plot(x, y)
>>> axes[1, 1].scatter(x, y)
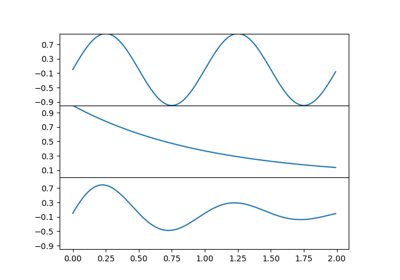
Share a X axis with each column of subplots
>>> plt.subplots(2, 2, sharex='col')
Share a Y axis with each row of subplots
>>> plt.subplots(2, 2, sharey='row')
Share both X and Y axes with all subplots
>>> plt.subplots(2, 2, sharex='all', sharey='all')
Note that this is the same as
>>> plt.subplots(2, 2, sharex=True, sharey=True)
matplotlib.pyplot.subplots