import matplotlib.pyplot as plt
from mpl_toolkits.axes_grid1.colorbar import colorbar
plt.rcParams["text.usetex"] = False
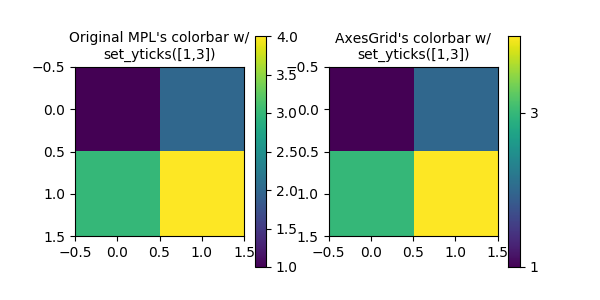
fig, (ax1, ax2) = plt.subplots(1, 2, figsize=(6, 3))
im1 = ax1.imshow([[1, 2], [3, 4]])
cb1 = fig.colorbar(im1, ax=ax1)
cb1.ax.set_yticks([1, 3])
ax1.set_title("Original MPL's colorbar w/\nset_yticks([1,3])", size=10)
im2 = ax2.imshow([[1, 2], [3, 4]])
cb2 = colorbar(im2, ax=ax2)
cb2.ax.set_yticks([1, 3])
ax2.set_title("AxesGrid's colorbar w/\nset_yticks([1,3])", size=10)
plt.show()
Total running time of the script: ( 0 minutes 0.074 seconds)
