Sometimes you know what your data looks like before you plot it, and may know for instance that there won’t be much data in the upper right hand corner. Then you can safely create a legend that doesn’t overlay your data:
ax.legend(loc=’upper right’)
Other times you don’t know where your data is, and loc=’best’ will try and place the legend:
ax.legend(loc='best')
but still, your legend may overlap your data, and in these cases it’s nice to make the legend frame transparent.
import matplotlib.pyplot as plt
import numpy as np
np.random.seed(1234)
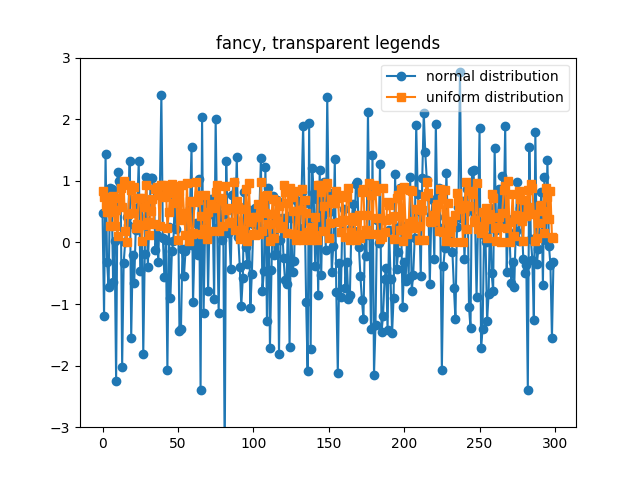
fig, ax = plt.subplots(1)
ax.plot(np.random.randn(300), 'o-', label='normal distribution')
ax.plot(np.random.rand(300), 's-', label='uniform distribution')
ax.set_ylim(-3, 3)
ax.legend(loc='best', fancybox=True, framealpha=0.5)
ax.set_title('fancy, transparent legends')
Total running time of the script: ( 0 minutes 0.019 seconds)
