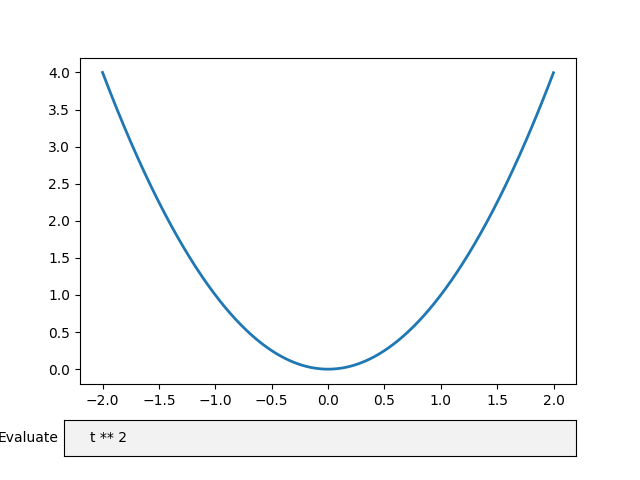
Allowing text input with the Textbox widget.
You can use the Textbox widget to let users provide any text that needs to be displayed, including formulas. You can use a submit button to create plots with the given input.
import numpy as np
import matplotlib.pyplot as plt
from matplotlib.widgets import TextBox
fig, ax = plt.subplots()
plt.subplots_adjust(bottom=0.2)
t = np.arange(-2.0, 2.0, 0.001)
s = t ** 2
initial_text = "t ** 2"
l, = plt.plot(t, s, lw=2)


def submit(text):
    ydata = eval(text)
    l.set_ydata(ydata)
    ax.set_ylim(np.min(ydata), np.max(ydata))
    plt.draw()

axbox = plt.axes([0.1, 0.05, 0.8, 0.075])
text_box = TextBox(axbox, 'Evaluate', initial=initial_text)
text_box.on_submit(submit)

plt.show()
Total running time of the script: ( 0 minutes 0.036 seconds)
