import matplotlib.pyplot as plt
from numpy import pi, sin, linspace
from matplotlib.mlab import stineman_interp
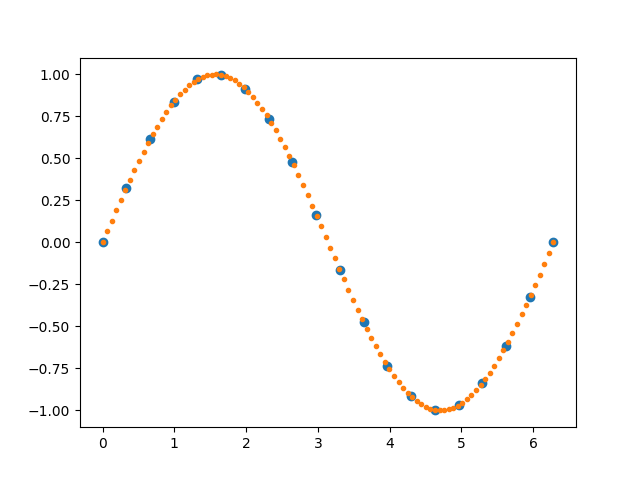
x = linspace(0, 2*pi, 20)
y = sin(x)
yp = None
xi = linspace(x[0], x[-1], 100)
yi = stineman_interp(xi, x, y, yp)
fig, ax = plt.subplots()
ax.plot(x, y, 'o', xi, yi, '.')
plt.show()
Total running time of the script: ( 0 minutes 0.017 seconds)
