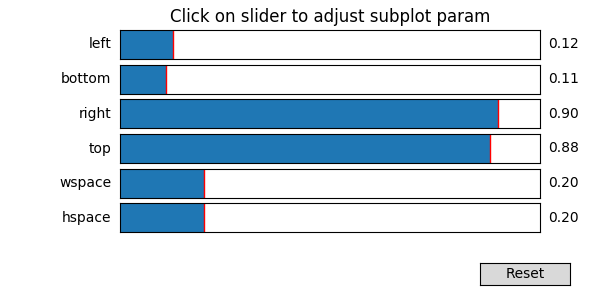
Matplotlib has a toolbar available for adjusting suplot spacing.
import matplotlib.pyplot as plt
import numpy as np
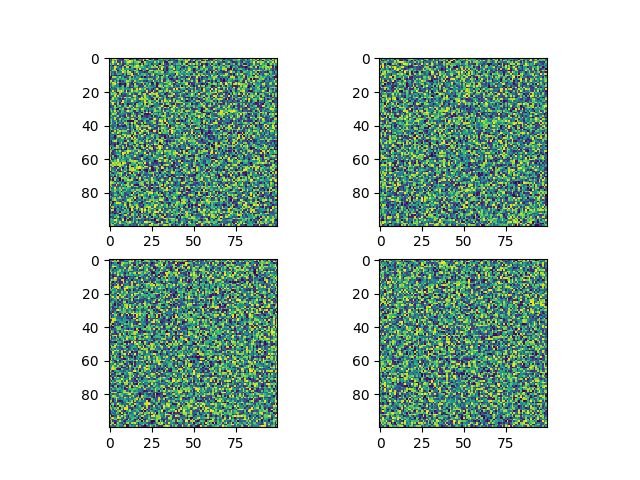
fig, axs = plt.subplots(2, 2)
axs[0, 0].imshow(np.random.random((100, 100)))
axs[0, 1].imshow(np.random.random((100, 100)))
axs[1, 0].imshow(np.random.random((100, 100)))
axs[1, 1].imshow(np.random.random((100, 100)))
plt.subplot_tool()
plt.show()
Total running time of the script: ( 0 minutes 0.219 seconds)
