import matplotlib.mlab as mlab
import matplotlib.pyplot as plt
import numpy as np
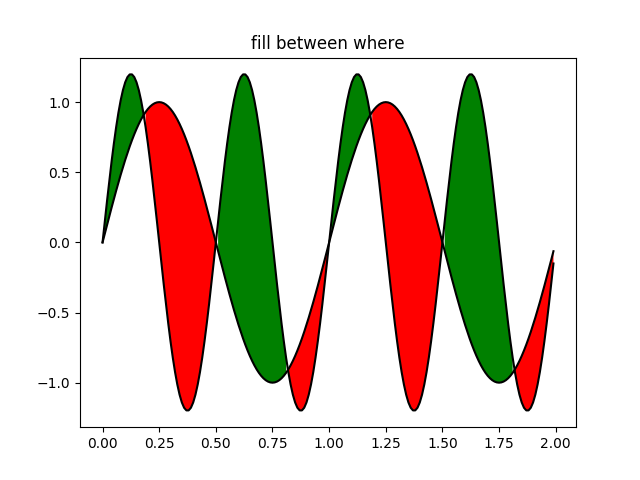
x = np.arange(0.0, 2, 0.01)
y1 = np.sin(2*np.pi*x)
y2 = 1.2*np.sin(4*np.pi*x)
fig, ax = plt.subplots()
ax.plot(x, y1, x, y2, color='black')
ax.fill_between(x, y1, y2, where=y2>y1, facecolor='green')
ax.fill_between(x, y1, y2, where=y2<=y1, facecolor='red')
ax.set_title('fill between where')
plt.show()
Total running time of the script: ( 0 minutes 0.019 seconds)
