Setting the behavior of tick auto-placement.
If you don’t explicitly set tick positions / labels, Matplotlib will attempt to choose them both automatically based on the displayed data and its limits.
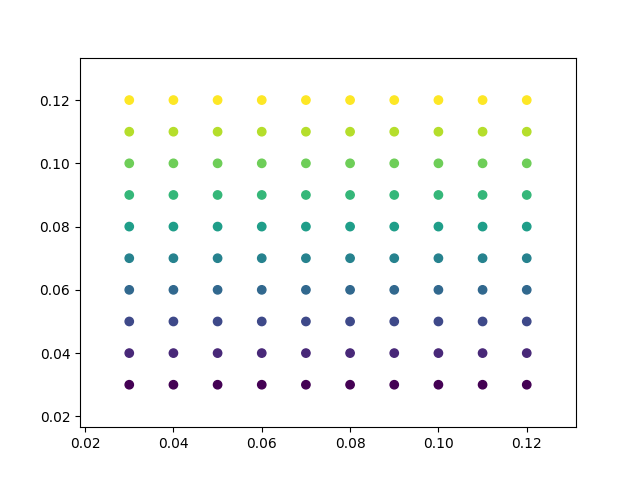
By default, this attempts to choose tick positions that are distributed along the axis:
import matplotlib.pyplot as plt
import numpy as np
np.random.seed(19680801)

fig, ax = plt.subplots()
dots = np.arange(10) / 100. + .03
x, y = np.meshgrid(dots, dots)
data = [x.ravel(), y.ravel()]
ax.scatter(*data, c=data[1])
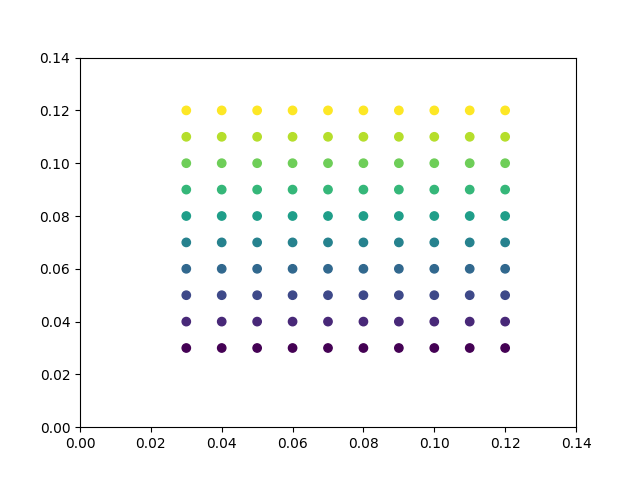
Sometimes choosing evenly-distributed ticks results in strange tick numbers. If you’d like Matplotlib to keep ticks located at round numbers, you can change this behavior with the following rcParams value:
print(plt.rcParams['axes.autolimit_mode'])

# Now change this value and see the results
with plt.rc_context({'axes.autolimit_mode': 'round_numbers'}):
    fig, ax = plt.subplots()
    ax.scatter(*data, c=data[1])
Out:
data
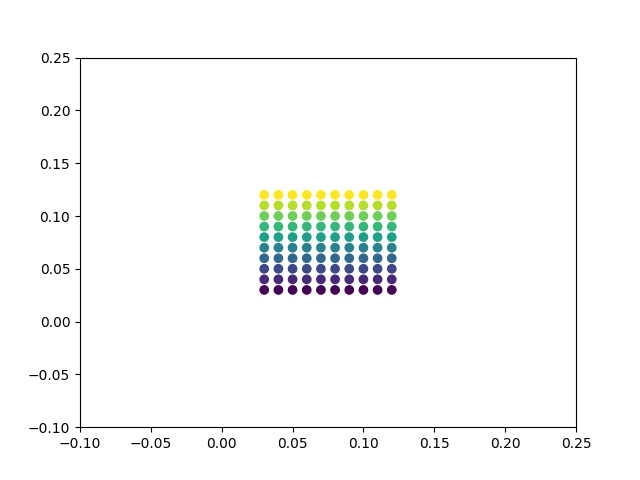
You can also alter the margins of the axes around the data by
with axes.(x,y)margin:
with plt.rc_context({'axes.autolimit_mode': 'round_numbers',
                     'axes.xmargin': .8,
                     'axes.ymargin': .8}):
    fig, ax = plt.subplots()
    ax.scatter(*data, c=data[1])

plt.show()
Total running time of the script: ( 0 minutes 0.055 seconds)
