This tutorial shows how to build colorbars without an attached plot.
ColorbarBase derives from
ScalarMappable and puts a colorbar in a specified axes,
so it has everything needed for a standalone colorbar. It can be used as is to
make a colorbar for a given colormap and does not need a mappable object like
an image. In this tutorial we will explore what can be done with standalone
colorbar.
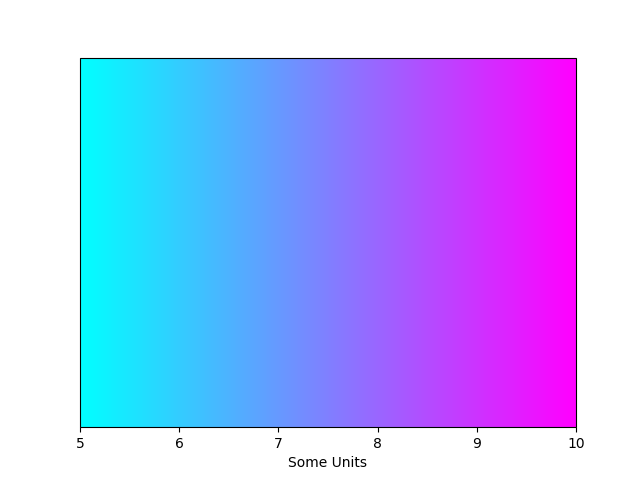
Set the colormap and norm to correspond to the data for which the colorbar
will be used. Then create the colorbar by calling
ColorbarBase and specify axis, colormap, norm
and orientation as parameters. Here we create a basic continuous colorbar
with ticks and labels. More information on colorbar api can be found
here.
import matplotlib.pyplot as plt
import matplotlib as mpl

fig, ax = plt.subplots()

cmap = mpl.cm.cool
norm = mpl.colors.Normalize(vmin=5, vmax=10)

cb1 = mpl.colorbar.ColorbarBase(ax, cmap=cmap,
                                norm=norm,
                                orientation='horizontal')
cb1.set_label('Some Units')
fig.show()
The second example illustrates the use of a
ListedColormap which generates a colormap from a
set of listed colors, colors.BoundaryNorm() which generates a colormap
index based on discrete intervals and extended ends to show the “over” and
“under” value colors. Over and under are used to display data outside of the
normalized [0,1] range. Here we pass colors as gray shades as a string
encoding a float in the 0-1 range.
If a ListedColormap is used, the length of the
bounds array must be one greater than the length of the color list. The
bounds must be monotonically increasing.
This time we pass some more arguments in addition to previous arguments to
ColorbarBase. For the out-of-range values to
display on the colorbar, we have to use the extend keyword argument. To use
extend, you must specify two extra boundaries. Finally spacing argument
ensures that intervals are shown on colorbar proportionally.
fig, ax = plt.subplots()

cmap = mpl.colors.ListedColormap(['red', 'green', 'blue', 'cyan'])
cmap.set_over('0.25')
cmap.set_under('0.75')

bounds = [1, 2, 4, 7, 8]
norm = mpl.colors.BoundaryNorm(bounds, cmap.N)
cb2 = mpl.colorbar.ColorbarBase(ax, cmap=cmap,
                                norm=norm,
                                boundaries=[0] + bounds + [13],
                                extend='both',
                                ticks=bounds,
                                spacing='proportional',
                                orientation='horizontal')
cb2.set_label('Discrete intervals, some other units')
fig.show()
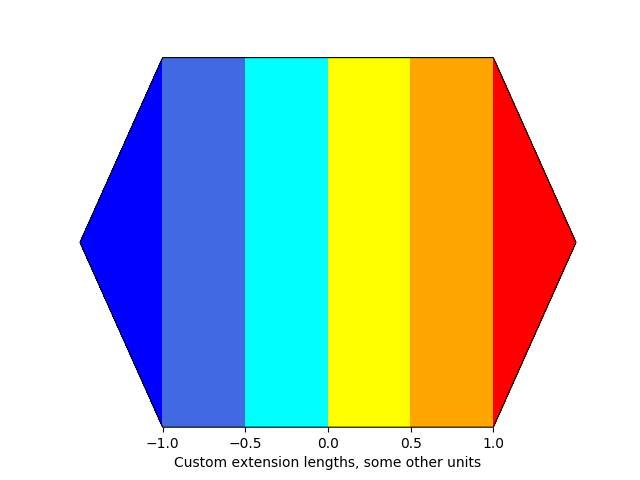
Here we illustrate the use of custom length colorbar extensions, used on a
colorbar with discrete intervals. To make the length of each extension same
as the length of the interior colors, use extendfrac='auto'.
fig, ax = plt.subplots()

cmap = mpl.colors.ListedColormap(['royalblue', 'cyan',
                                  'yellow', 'orange'])
cmap.set_over('red')
cmap.set_under('blue')

bounds = [-1.0, -0.5, 0.0, 0.5, 1.0]
norm = mpl.colors.BoundaryNorm(bounds, cmap.N)
cb3 = mpl.colorbar.ColorbarBase(ax, cmap=cmap,
                                norm=norm,
                                boundaries=[-10] + bounds + [10],
                                extend='both',
                                extendfrac='auto',
                                ticks=bounds,
                                spacing='uniform',
                                orientation='horizontal')
cb3.set_label('Custom extension lengths, some other units')
fig.show()
Total running time of the script: ( 0 minutes 0.059 seconds)
