Matplotlib recognizes the following formats to specify a color:
[0, 1] (e.g., (0.1, 0.2, 0.5)
or (0.1, 0.2, 0.5, 0.3));'#0F0F0F' or '#0F0F0F0F');[0, 1] inclusive for gray
level (e.g., '0.5');{'b', 'g', 'r', 'c', 'm', 'y', 'k', 'w'};'xkcd:' (e.g., 'xkcd:sky blue');{'tab:blue', 'tab:orange', 'tab:green',
'tab:red', 'tab:purple', 'tab:brown', 'tab:pink',
'tab:gray', 'tab:olive', 'tab:cyan'} which are the Tableau Colors from the
‘T10’ categorical palette (which is the default color cycle);'C' followed by a single digit, which is an index
into the default property cycle (matplotlib.rcParams['axes.prop_cycle']);
the indexing occurs at artist creation time and defaults to black if the
cycle does not include color.All string specifications of color, other than “CN”, are case-insensitive.
“CN” colors are converted to RGBA as soon as the artist is created. For example,
import numpy as np
import matplotlib.pyplot as plt
import matplotlib as mpl

th = np.linspace(0, 2*np.pi, 128)


def demo(sty):
    mpl.style.use(sty)
    fig, ax = plt.subplots(figsize=(3, 3))

    ax.set_title('style: {!r}'.format(sty), color='C0')

    ax.plot(th, np.cos(th), 'C1', label='C1')
    ax.plot(th, np.sin(th), 'C2', label='C2')
    ax.legend()

demo('default')
demo('seaborn')
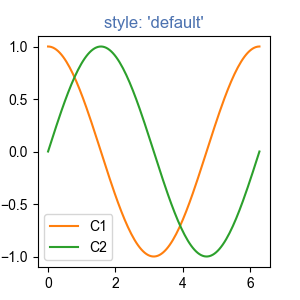
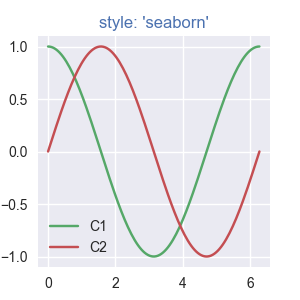
will use the first color for the title and then plot using the second
and third colors of each style’s mpl.rcParams['axes.prop_cycle'].
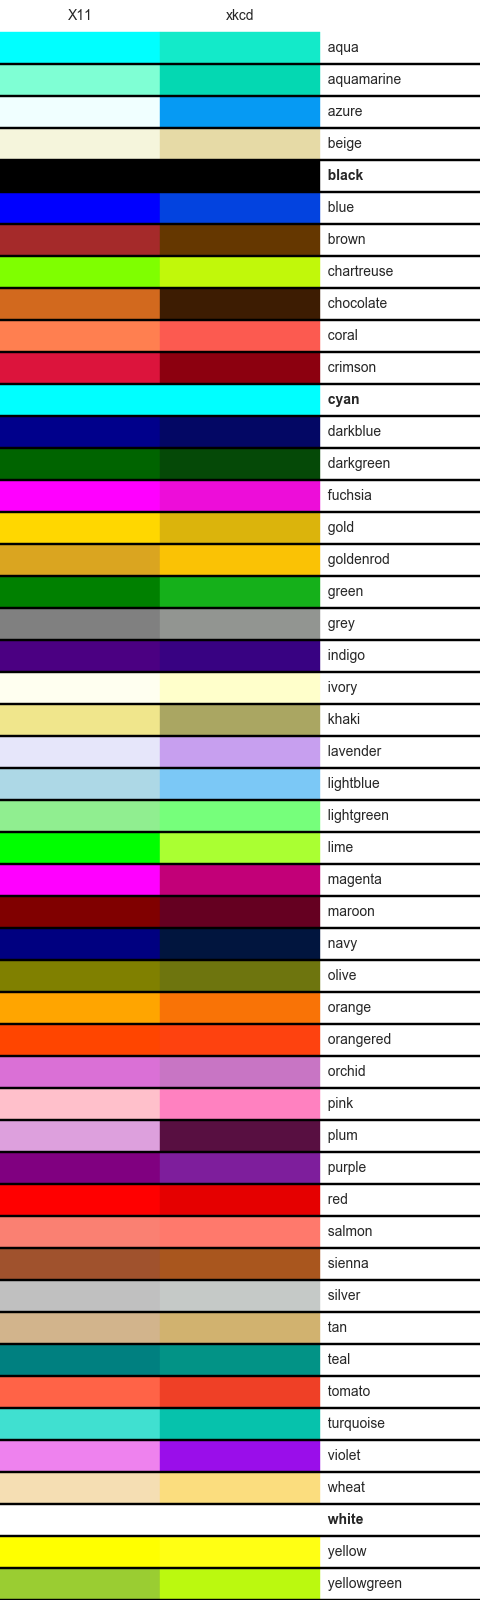
The xkcd colors are derived from a user survey conducted by the webcomic xkcd. Details of the survey are available on the xkcd blog.
Out of 148 colors in the CSS color list, there are 95 name collisions
between the X11/CSS4 names and the xkcd names, all but 3 of which have
different hex values. For example 'blue' maps to '#0000FF'
where as 'xkcd:blue' maps to '#0343DF'. Due to these name
collisions all of the xkcd colors have 'xkcd:' prefixed. As noted in
the blog post, while it might be interesting to re-define the X11/CSS4 names
based on such a survey, we do not do so unilaterally.
The name collisions are shown in the table below; the color names where the hex values agree are shown in bold.
import matplotlib._color_data as mcd
import matplotlib.patches as mpatch

overlap = {name for name in mcd.CSS4_COLORS
           if "xkcd:" + name in mcd.XKCD_COLORS}

fig = plt.figure(figsize=[4.8, 16])
ax = fig.add_axes([0, 0, 1, 1])

for j, n in enumerate(sorted(overlap, reverse=True)):
    weight = None
    cn = mcd.CSS4_COLORS[n]
    xkcd = mcd.XKCD_COLORS["xkcd:" + n].upper()
    if cn == xkcd:
        weight = 'bold'

    r1 = mpatch.Rectangle((0, j), 1, 1, color=cn)
    r2 = mpatch.Rectangle((1, j), 1, 1, color=xkcd)
    txt = ax.text(2, j+.5, '  ' + n, va='center', fontsize=10,
                  weight=weight)
    ax.add_patch(r1)
    ax.add_patch(r2)
    ax.axhline(j, color='k')

ax.text(.5, j + 1.5, 'X11', ha='center', va='center')
ax.text(1.5, j + 1.5, 'xkcd', ha='center', va='center')
ax.set_xlim(0, 3)
ax.set_ylim(0, j + 2)
ax.axis('off')
Total running time of the script: ( 0 minutes 0.127 seconds)
