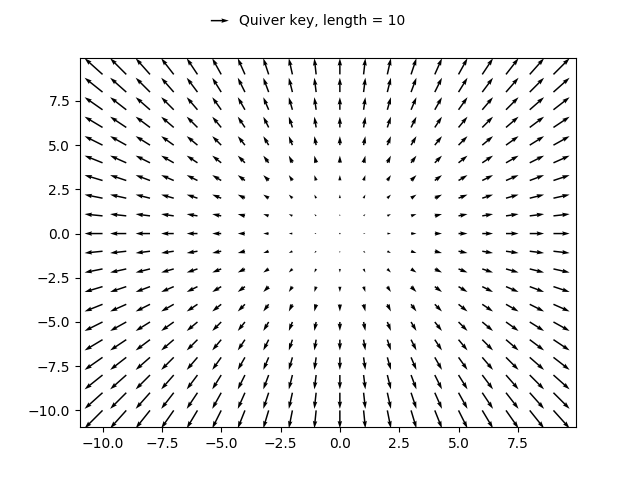
A simple example of a quiver plot with a quiverkey.
import matplotlib.pyplot as plt
import numpy as np

X = np.arange(-10, 10, 1)
Y = np.arange(-10, 10, 1)
U, V = np.meshgrid(X, Y)

fig, ax = plt.subplots()
q = ax.quiver(X, Y, U, V)
ax.quiverkey(q, X=0.3, Y=1.1, U=10,
             label='Quiver key, length = 10', labelpos='E')

plt.show()
Total running time of the script: ( 0 minutes 0.017 seconds)
