matplotlib.pyplot.subplots#
- matplotlib.pyplot.subplots(nrows=1, ncols=1, *, sharex=False, sharey=False, squeeze=True, width_ratios=None, height_ratios=None, subplot_kw=None, gridspec_kw=None, **fig_kw)[source]#
Create a figure and a set of subplots.
This utility wrapper makes it convenient to create common layouts of subplots, including the enclosing figure object, in a single call.
- Parameters:
- nrows, ncolsint, default: 1
Number of rows/columns of the subplot grid.
- sharex, shareybool or {'none', 'all', 'row', 'col'}, default: False
Controls sharing of properties among x (sharex) or y (sharey) axes:
True or 'all': x- or y-axis will be shared among all subplots.
False or 'none': each subplot x- or y-axis will be independent.
'row': each subplot row will share an x- or y-axis.
'col': each subplot column will share an x- or y-axis.
When subplots have a shared x-axis along a column, only the x tick labels of the bottom subplot are created. Similarly, when subplots have a shared y-axis along a row, only the y tick labels of the first column subplot are created. To later turn other subplots' ticklabels on, use
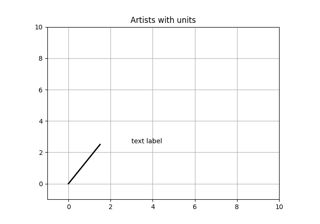
tick_params.When subplots have a shared axis that has units, calling
set_unitswill update each axis with the new units.- squeezebool, default: True
If True, extra dimensions are squeezed out from the returned array of
Axes:if only one subplot is constructed (nrows=ncols=1), the resulting single Axes object is returned as a scalar.
for Nx1 or 1xM subplots, the returned object is a 1D numpy object array of Axes objects.
for NxM, subplots with N>1 and M>1 are returned as a 2D array.
If False, no squeezing at all is done: the returned Axes object is always a 2D array containing Axes instances, even if it ends up being 1x1.
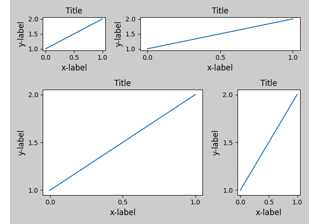
- width_ratiosarray-like of length ncols, optional
Defines the relative widths of the columns. Each column gets a relative width of
width_ratios[i] / sum(width_ratios). If not given, all columns will have the same width. Equivalent togridspec_kw={'width_ratios': [...]}.- height_ratiosarray-like of length nrows, optional
Defines the relative heights of the rows. Each row gets a relative height of
height_ratios[i] / sum(height_ratios). If not given, all rows will have the same height. Convenience forgridspec_kw={'height_ratios': [...]}.- subplot_kwdict, optional
Dict with keywords passed to the
add_subplotcall used to create each subplot.- gridspec_kwdict, optional
Dict with keywords passed to the
GridSpecconstructor used to create the grid the subplots are placed on.- **fig_kw
All additional keyword arguments are passed to the
pyplot.figurecall.
- Returns:
- fig
Figure - ax
Axesor array of Axes ax can be either a single
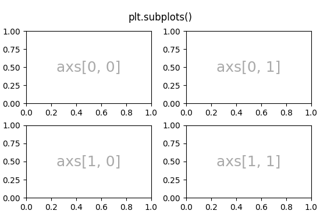
Axesobject, or an array of Axes objects if more than one subplot was created. The dimensions of the resulting array can be controlled with the squeeze keyword, see above.Typical idioms for handling the return value are:
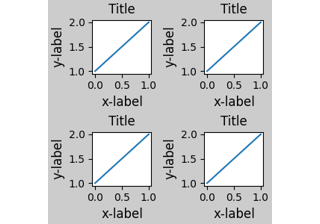
# using the variable ax for single a Axes
fig, ax = plt.subplots()

# using the variable axs for multiple Axes
fig, axs = plt.subplots(2, 2)

# using tuple unpacking for multiple Axes
fig, (ax1, ax2) = plt.subplots(1, 2)
fig, ((ax1, ax2), (ax3, ax4)) = plt.subplots(2, 2)
The names
axand pluralizedaxsare preferred overaxesbecause for the latter it's not clear if it refers to a singleAxesinstance or a collection of these.
- fig
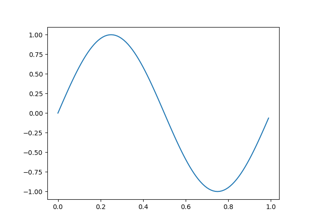
Examples
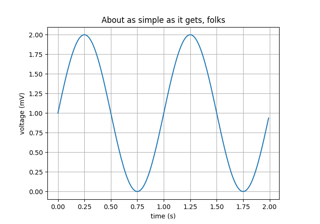
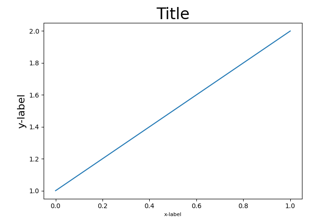
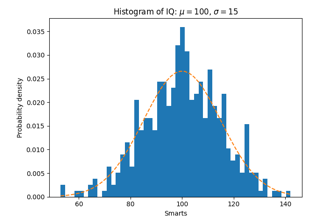
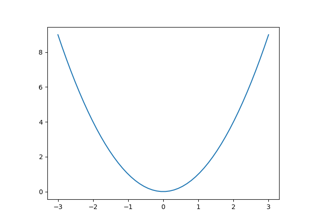
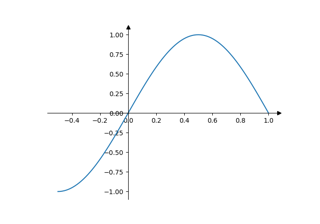
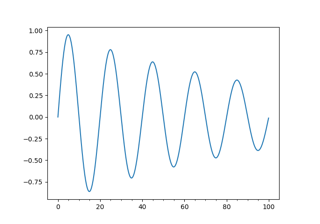
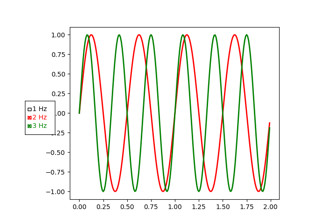
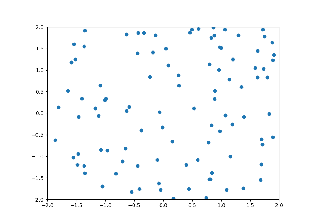
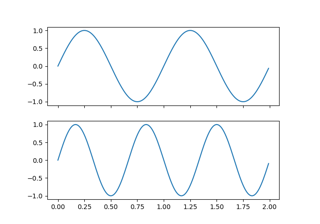
# First create some toy data:
x = np.linspace(0, 2*np.pi, 400)
y = np.sin(x**2)

# Create just a figure and only one subplot
fig, ax = plt.subplots()
ax.plot(x, y)
ax.set_title('Simple plot')

# Create two subplots and unpack the output array immediately
f, (ax1, ax2) = plt.subplots(1, 2, sharey=True)
ax1.plot(x, y)
ax1.set_title('Sharing Y axis')
ax2.scatter(x, y)

# Create four polar axes and access them through the returned array
fig, axs = plt.subplots(2, 2, subplot_kw=dict(projection="polar"))
axs[0, 0].plot(x, y)
axs[1, 1].scatter(x, y)

# Share a X axis with each column of subplots
plt.subplots(2, 2, sharex='col')

# Share a Y axis with each row of subplots
plt.subplots(2, 2, sharey='row')

# Share both X and Y axes with all subplots
plt.subplots(2, 2, sharex='all', sharey='all')

# Note that this is the same as
plt.subplots(2, 2, sharex=True, sharey=True)

# Create figure number 10 with a single subplot
# and clears it if it already exists.
fig, ax = plt.subplots(num=10, clear=True)
Examples using matplotlib.pyplot.subplots#
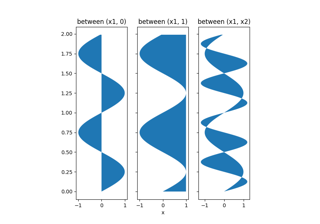
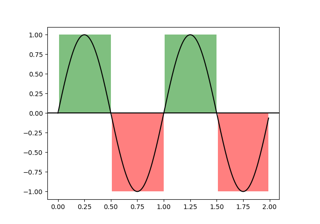
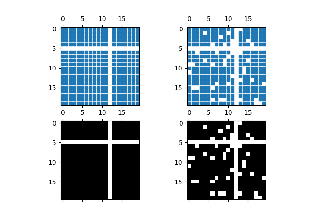
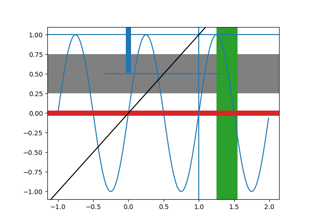
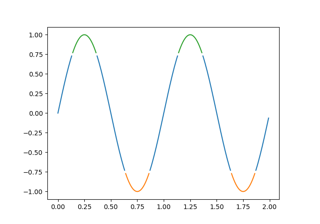
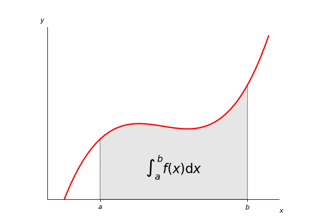
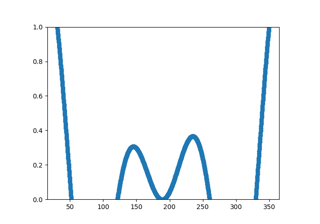
Shade regions defined by a logical mask using fill_between


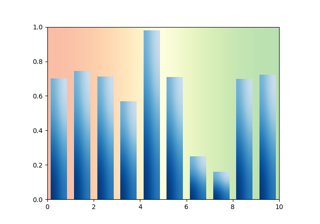
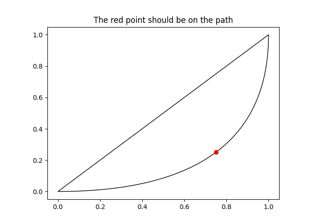
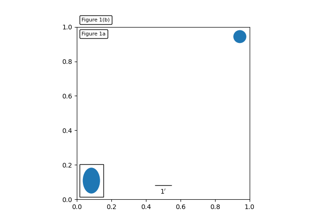
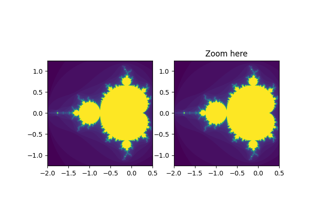
Controlling view limits using margins and sticky_edges

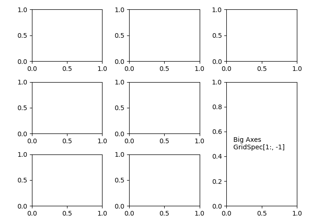
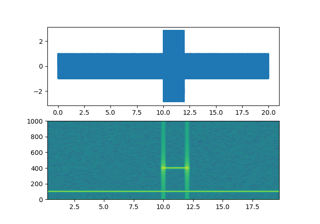
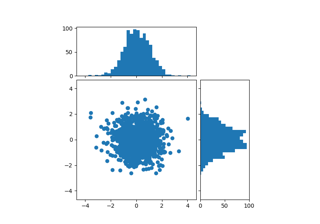
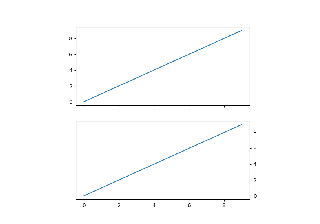
Combining two subplots using subplots and GridSpec
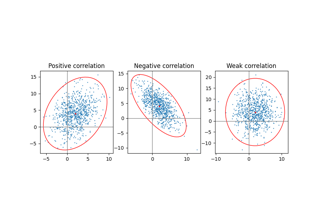
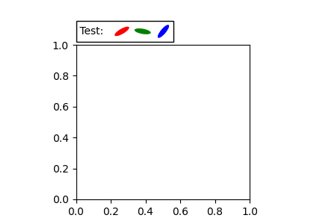
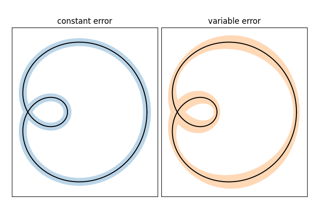
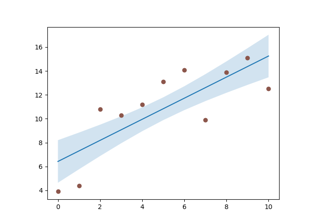
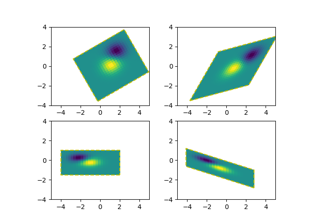
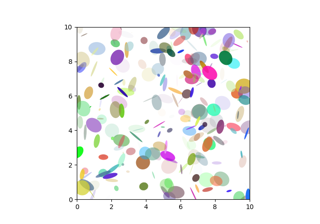
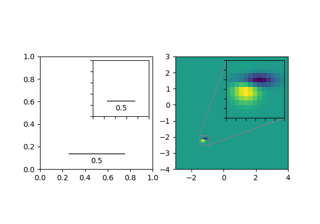
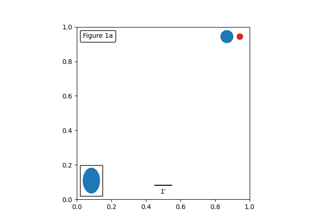
Plot a confidence ellipse of a two-dimensional dataset
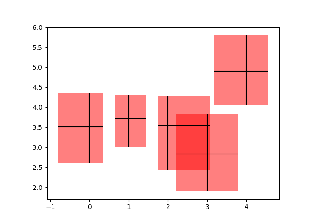
Creating boxes from error bars using PatchCollection
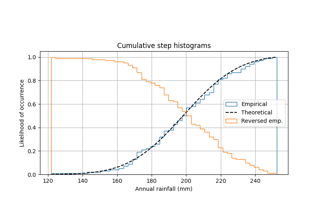
Using histograms to plot a cumulative distribution
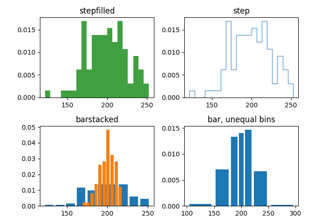
Demo of the histogram function's different histtype settings
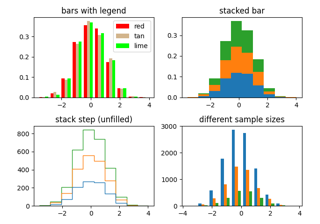
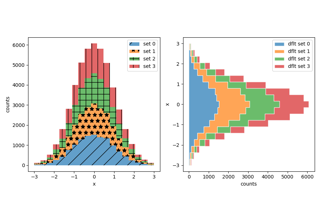
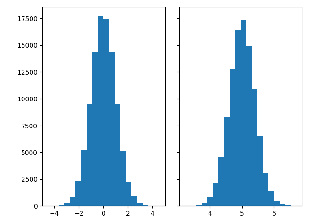
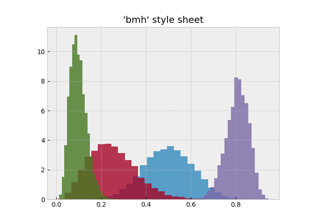
The histogram (hist) function with multiple data sets

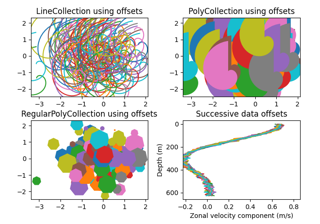
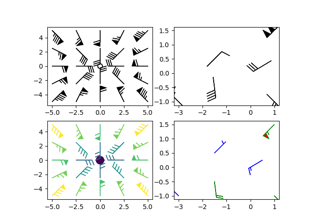
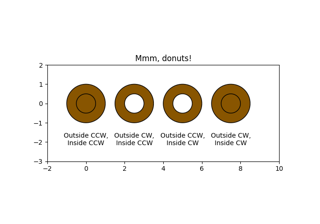
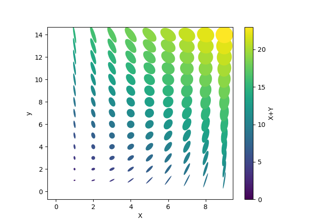
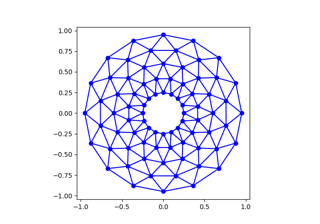
Line, Poly and RegularPoly Collection with autoscaling
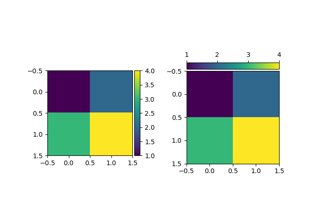
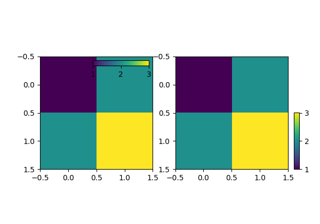
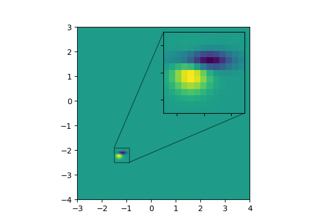
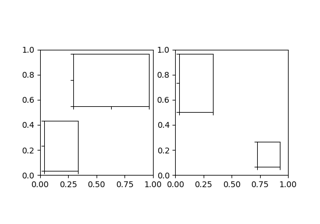
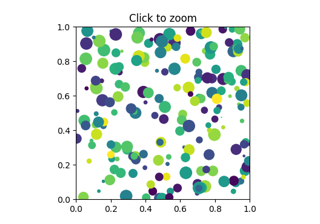
Controlling the position and size of colorbars with Inset Axes

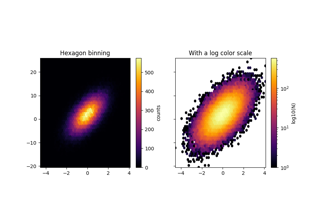
Building histograms using Rectangles and PolyCollections


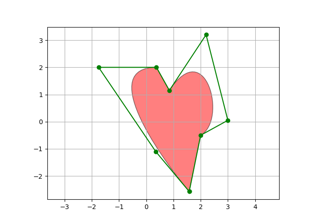
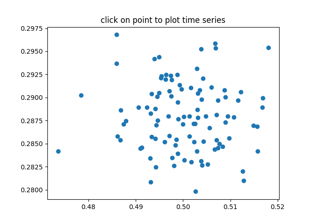
Select indices from a collection using polygon selector