matplotlib.axes.Axes.clabel#

Axes.clabel(CS, levels=None, **kwargs)[source]#

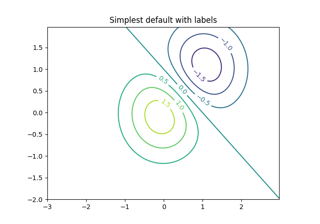
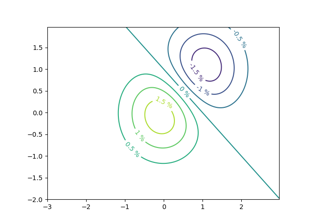
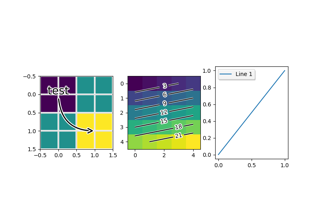
Label a contour plot.

Adds labels to line contours in given ContourSet.

Parameters:
CSContourSet instance

Line contours to label.

levelsarray-like, optional

A list of level values, that should be labeled. The list must be a subset of CS.levels. If not given, all levels are labeled.

**kwargs

All other parameters are documented in clabel.

Examples using matplotlib.axes.Axes.clabel#

Contour Demo

Contour Demo

Contour Demo
Contour Label Demo

Contour Label Demo

Contour Label Demo
Contourf demo

Contourf demo

Contourf demo
Contouring the solution space of optimizations

Contouring the solution space of optimizations

Contouring the solution space of optimizations
Patheffect Demo

Patheffect Demo

Patheffect Demo
TickedStroke patheffect

TickedStroke patheffect

TickedStroke patheffect