matplotlib.colors.AsinhNorm#
- class matplotlib.colors.AsinhNorm(linear_width=1, vmin=None, vmax=None, clip=False)[source]#
Bases:
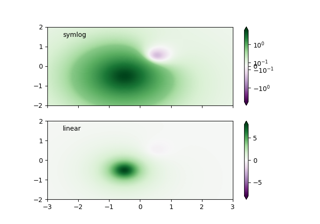
AsinhNormThe inverse hyperbolic sine scale is approximately linear near the origin, but becomes logarithmic for larger positive or negative values. Unlike the
SymLogNorm, the transition between these linear and logarithmic regions is smooth, which may reduce the risk of visual artifacts.Note
This API is provisional and may be revised in the future based on early user feedback.
- Parameters:
- linear_widthfloat, default: 1
The effective width of the linear region, beyond which the transformation becomes asymptotically logarithmic
- Parameters:
- vmin, vmaxfloat or None
If vmin and/or vmax is not given, they are initialized from the minimum and maximum value, respectively, of the first input processed; i.e.,
__call__(A)callsautoscale_None(A).- clipbool, default: False
If
Truevalues falling outside the range[vmin, vmax], are mapped to 0 or 1, whichever is closer, and masked values are set to 1. IfFalsemasked values remain masked.Clipping silently defeats the purpose of setting the over, under, and masked colors in a colormap, so it is likely to lead to surprises; therefore the default is
clip=False.
Notes
Returns 0 if
vmin == vmax.- __call__(value, clip=None)[source]#
Normalize value data in the
[vmin, vmax]interval into the[0.0, 1.0]interval and return it.- Parameters:
- value
Data to normalize.
- clipbool
If
None, defaults toself.clip(which defaults toFalse).
Notes
If not already initialized,
self.vminandself.vmaxare initialized usingself.autoscale_None(value).