matplotlib.patches.Patch#
- class matplotlib.patches.Patch(*, edgecolor=None, facecolor=None, color=None, linewidth=None, linestyle=None, antialiased=None, hatch=None, fill=True, capstyle=None, joinstyle=None, **kwargs)[source]#
Bases:
ArtistA patch is a 2D artist with a face color and an edge color.
If any of edgecolor, facecolor, linewidth, or antialiased are None, they default to their rc params setting.
The following kwarg properties are supported
Property
Description
a filter function, which takes a (m, n, 3) float array and a dpi value, and returns a (m, n, 3) array and two offsets from the bottom left corner of the image
unknown
bool
antialiasedor aabool or None
CapStyleor {'butt', 'projecting', 'round'}bool
Patch or (Path, Transform) or None
color
edgecoloror eccolor or None
facecoloror fccolor or None
bool
str
{'/', '\', '|', '-', '+', 'x', 'o', 'O', '.', '*'}
bool
JoinStyleor {'miter', 'round', 'bevel'}object
linestyleor ls{'-', '--', '-.', ':', '', (offset, on-off-seq), ...}
linewidthor lwfloat or None
bool
None or bool or float or callable
bool
(scale: float, length: float, randomness: float)
bool or None
str
bool
float
- contains(mouseevent, radius=None)[source]#
Test whether the mouse event occurred in the patch.
- Returns:
- (bool, empty dict)
- contains_point(point, radius=None)[source]#
Return whether the given point is inside the patch.
- Parameters:
- point(float, float)
The point (x, y) to check, in target coordinates of
self.get_transform(). These are display coordinates for patches that are added to a figure or axes.- radiusfloat, optional
Additional margin on the patch in target coordinates of
self.get_transform(). SeePath.contains_pointfor further details.
- Returns:
- bool
Notes
The proper use of this method depends on the transform of the patch. Isolated patches do not have a transform. In this case, the patch creation coordinates and the point coordinates match. The following example checks that the center of a circle is within the circle
>>> center = 0, 0
>>> c = Circle(center, radius=1)
>>> c.contains_point(center)
True
The convention of checking against the transformed patch stems from the fact that this method is predominantly used to check if display coordinates (e.g. from mouse events) are within the patch. If you want to do the above check with data coordinates, you have to properly transform them first:
>>> center = 0, 0
>>> c = Circle(center, radius=1)
>>> plt.gca().add_patch(c)
>>> transformed_center = c.get_transform().transform(center)
>>> c.contains_point(transformed_center)
True
- contains_points(points, radius=None)[source]#
Return whether the given points are inside the patch.
- Parameters:
- points(N, 2) array
The points to check, in target coordinates of
self.get_transform(). These are display coordinates for patches that are added to a figure or axes. Columns contain x and y values.- radiusfloat, optional
Additional margin on the patch in target coordinates of
self.get_transform(). SeePath.contains_pointfor further details.
- Returns:
- length-N bool array
Notes
The proper use of this method depends on the transform of the patch. See the notes on
Patch.contains_point.
- draw(renderer)[source]#
Draw the Artist (and its children) using the given renderer.
This has no effect if the artist is not visible (
Artist.get_visiblereturns False).- Parameters:
- renderer
RendererBasesubclass.
- renderer
Notes
This method is overridden in the Artist subclasses.
- property fill#
Return whether the patch is filled.
- get_aa()[source]#
Alias for
get_antialiased.
- get_data_transform()[source]#
Return the
Transformmapping data coordinates to physical coordinates.
- get_ec()[source]#
Alias for
get_edgecolor.
- get_fc()[source]#
Alias for
get_facecolor.
- get_ls()[source]#
Alias for
get_linestyle.
- get_lw()[source]#
Alias for
get_linewidth.
- get_patch_transform()[source]#
Return the
Transforminstance mapping patch coordinates to data coordinates.For example, one may define a patch of a circle which represents a radius of 5 by providing coordinates for a unit circle, and a transform which scales the coordinates (the patch coordinate) by 5.
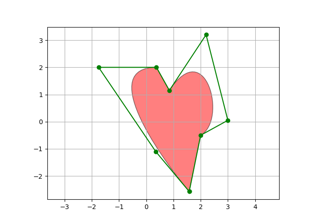
- get_verts()[source]#
Return a copy of the vertices used in this patch.
If the patch contains Bézier curves, the curves will be interpolated by line segments. To access the curves as curves, use
get_path.
- get_window_extent(renderer=None)[source]#
Get the artist's bounding box in display space.
The bounding box' width and height are nonnegative.
Subclasses should override for inclusion in the bounding box "tight" calculation. Default is to return an empty bounding box at 0, 0.
Be careful when using this function, the results will not update if the artist window extent of the artist changes. The extent can change due to any changes in the transform stack, such as changing the axes limits, the figure size, or the canvas used (as is done when saving a figure). This can lead to unexpected behavior where interactive figures will look fine on the screen, but will save incorrectly.
- set(*, agg_filter=<UNSET>, alpha=<UNSET>, animated=<UNSET>, antialiased=<UNSET>, capstyle=<UNSET>, clip_box=<UNSET>, clip_on=<UNSET>, clip_path=<UNSET>, color=<UNSET>, edgecolor=<UNSET>, facecolor=<UNSET>, fill=<UNSET>, gid=<UNSET>, hatch=<UNSET>, in_layout=<UNSET>, joinstyle=<UNSET>, label=<UNSET>, linestyle=<UNSET>, linewidth=<UNSET>, mouseover=<UNSET>, path_effects=<UNSET>, picker=<UNSET>, rasterized=<UNSET>, sketch_params=<UNSET>, snap=<UNSET>, transform=<UNSET>, url=<UNSET>, visible=<UNSET>, zorder=<UNSET>)[source]#
Set multiple properties at once.
Supported properties are
Property
Description
a filter function, which takes a (m, n, 3) float array and a dpi value, and returns a (m, n, 3) array and two offsets from the bottom left corner of the image
unknown
bool
bool or None
CapStyleor {'butt', 'projecting', 'round'}bool
Patch or (Path, Transform) or None
color
color or None
color or None
bool
str
{'/', '\', '|', '-', '+', 'x', 'o', 'O', '.', '*'}
bool
JoinStyleor {'miter', 'round', 'bevel'}object
{'-', '--', '-.', ':', '', (offset, on-off-seq), ...}
float or None
bool
None or bool or float or callable
bool
(scale: float, length: float, randomness: float)
bool or None
str
bool
float
- set_aa(aa)[source]#
Alias for
set_antialiased.
- set_alpha(alpha)[source]#
Set the alpha value used for blending - not supported on all backends.
- Parameters:
- alphascalar or None
alpha must be within the 0-1 range, inclusive.
- set_capstyle(s)[source]#
Set the
CapStyle.The default capstyle is 'round' for
FancyArrowPatchand 'butt' for all other patches.- Parameters:
- s
CapStyleor {'butt', 'projecting', 'round'}
- s
- set_color(c)[source]#
Set both the edgecolor and the facecolor.
- Parameters:
- ccolor
See also
Patch.set_facecolor,Patch.set_edgecolorFor setting the edge or face color individually.
- set_ec(color)[source]#
Alias for
set_edgecolor.
- set_fc(color)[source]#
Alias for
set_facecolor.
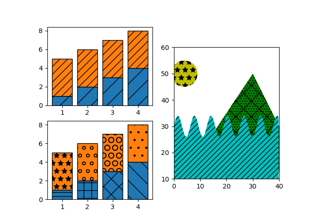
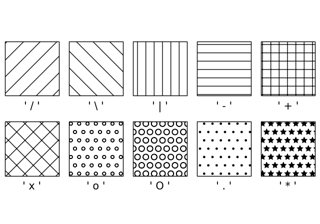
- set_hatch(hatch)[source]#
Set the hatching pattern.
hatch can be one of:
/   - diagonal hatching
\   - back diagonal
|   - vertical
-   - horizontal
+   - crossed
x   - crossed diagonal
o   - small circle
O   - large circle
.   - dots
*   - stars
Letters can be combined, in which case all the specified hatchings are done. If same letter repeats, it increases the density of hatching of that pattern.
Hatching is supported in the PostScript, PDF, SVG and Agg backends only.
- Parameters:
- hatch{'/', '\', '|', '-', '+', 'x', 'o', 'O', '.', '*'}
- set_joinstyle(s)[source]#
Set the
JoinStyle.The default joinstyle is 'round' for
FancyArrowPatchand 'miter' for all other patches.- Parameters:
- s
JoinStyleor {'miter', 'round', 'bevel'}
- s
- set_linestyle(ls)[source]#
Set the patch linestyle.
linestyle
description
'-'or'solid'solid line
'--'or'dashed'dashed line
'-.'or'dashdot'dash-dotted line
':'or'dotted'dotted line
'none','None',' ', or''draw nothing
Alternatively a dash tuple of the following form can be provided:
(offset, onoffseq)
where
onoffseqis an even length tuple of on and off ink in points.- Parameters:
- ls{'-', '--', '-.', ':', '', (offset, on-off-seq), ...}
The line style.
- set_ls(ls)[source]#
Alias for
set_linestyle.
- set_lw(w)[source]#
Alias for
set_linewidth.
- zorder = 1#
Examples using matplotlib.patches.Patch#
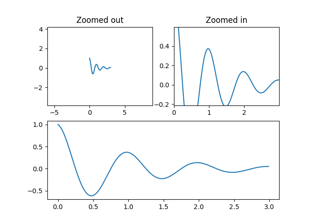
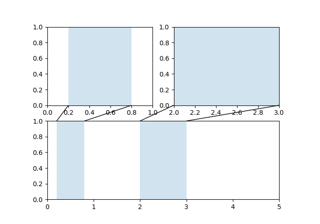
Controlling view limits using margins and sticky_edges
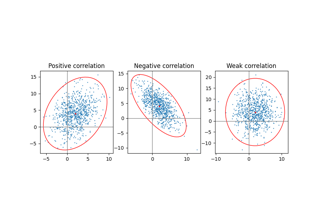
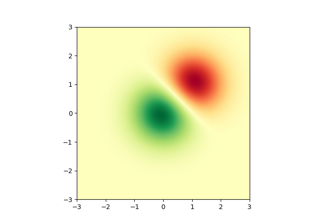
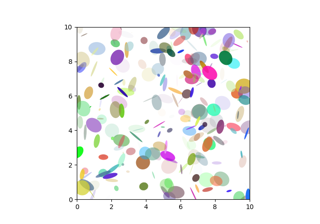
Plot a confidence ellipse of a two-dimensional dataset
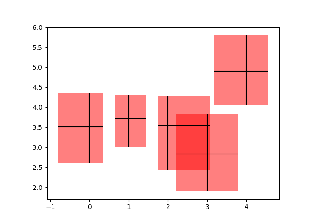
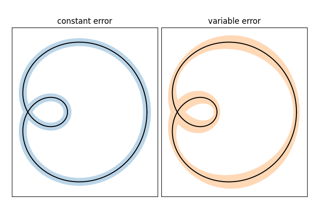
Creating boxes from error bars using PatchCollection

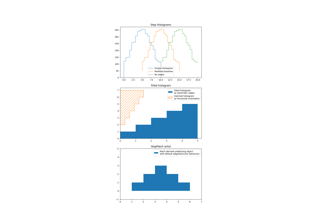
Building histograms using Rectangles and PolyCollections

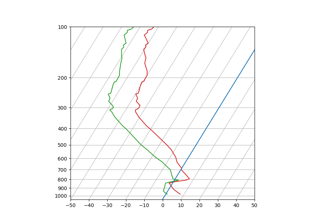
SkewT-logP diagram: using transforms and custom projections