mpl_toolkits.mplot3d.axes3d.Axes3D.errorbar#
- Axes3D.errorbar(x, y, z, zerr=None, yerr=None, xerr=None, fmt='', barsabove=False, errorevery=1, ecolor=None, elinewidth=None, capsize=None, capthick=None, xlolims=False, xuplims=False, ylolims=False, yuplims=False, zlolims=False, zuplims=False, *, data=None, **kwargs)[source]#
Plot lines and/or markers with errorbars around them.
x/y/z define the data locations, and xerr/yerr/zerr define the errorbar sizes. By default, this draws the data markers/lines as well the errorbars. Use fmt='none' to draw errorbars only.
- Parameters:
- x, y, zfloat or array-like
The data positions.
- xerr, yerr, zerrfloat or array-like, shape (N,) or (2, N), optional
The errorbar sizes:
scalar: Symmetric +/- values for all data points.
shape(N,): Symmetric +/-values for each data point.
shape(2, N): Separate - and + values for each bar. First row contains the lower errors, the second row contains the upper errors.
None: No errorbar.
Note that all error arrays should have positive values.
- fmtstr, default: ''
The format for the data points / data lines. See
plotfor details.Use 'none' (case-insensitive) to plot errorbars without any data markers.
- ecolorcolor, default: None
The color of the errorbar lines. If None, use the color of the line connecting the markers.
- elinewidthfloat, default: None
The linewidth of the errorbar lines. If None, the linewidth of the current style is used.
- capsizefloat, default:
rcParams["errorbar.capsize"](default:0.0) The length of the error bar caps in points.
- capthickfloat, default: None
An alias to the keyword argument markeredgewidth (a.k.a. mew). This setting is a more sensible name for the property that controls the thickness of the error bar cap in points. For backwards compatibility, if mew or markeredgewidth are given, then they will over-ride capthick. This may change in future releases.
- barsabovebool, default: False
If True, will plot the errorbars above the plot symbols. Default is below.
- xlolims, ylolims, zlolimsbool, default: False
These arguments can be used to indicate that a value gives only lower limits. In that case a caret symbol is used to indicate this. lims-arguments may be scalars, or array-likes of the same length as the errors. To use limits with inverted axes,
set_xlimorset_ylimmust be called beforeerrorbar. Note the tricky parameter names: setting e.g. ylolims to True means that the y-value is a lower limit of the True value, so, only an upward-pointing arrow will be drawn!- xuplims, yuplims, zuplimsbool, default: False
Same as above, but for controlling the upper limits.
- erroreveryint or (int, int), default: 1
draws error bars on a subset of the data. errorevery =N draws error bars on the points (x[::N], y[::N], z[::N]). errorevery =(start, N) draws error bars on the points (x[start::N], y[start::N], z[start::N]). e.g. errorevery=(6, 3) adds error bars to the data at (x[6], x[9], x[12], x[15], ...). Used to avoid overlapping error bars when two series share x-axis values.
- Returns:
- errlineslist
List of
Line3DCollectioninstances each containing an errorbar line.- caplineslist
List of
Line3Dinstances each containing a capline object.- limmarkslist
List of
Line3Dinstances each containing a marker with an upper or lower limit.
- Other Parameters:
- dataindexable object, optional
If given, the following parameters also accept a string
s, which is interpreted asdata[s](unless this raises an exception):x, y, z, xerr, yerr, zerr
- **kwargs
All other keyword arguments for styling errorbar lines are passed
Line3DCollection.
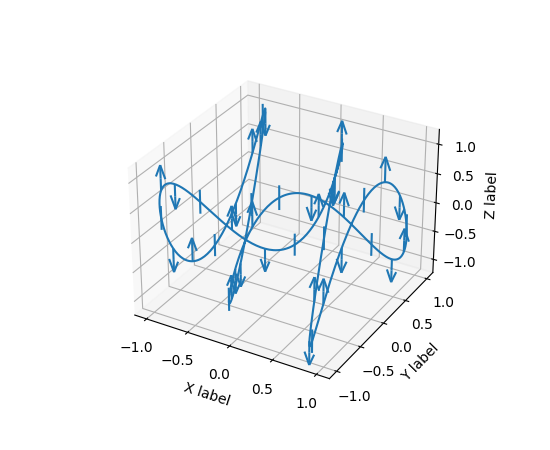
Examples
(
Source code,png)