Note
Click here to download the full example code
Manual Contour#
Example of displaying your own contour lines and polygons using ContourSet.
import matplotlib.pyplot as plt
from matplotlib.contour import ContourSet
import matplotlib.cm as cm
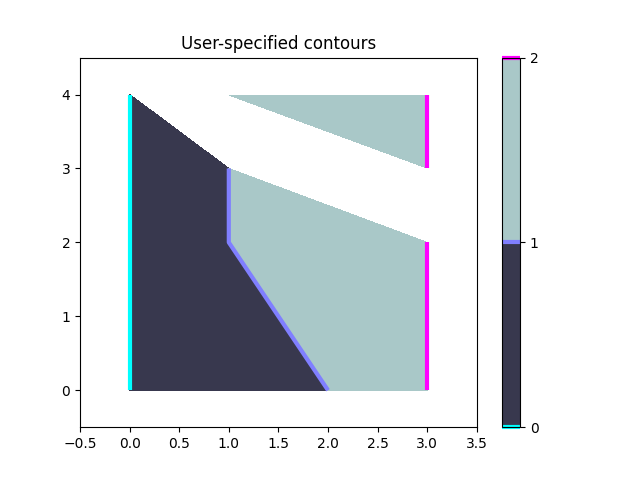
Contour lines for each level are a list/tuple of polygons.
Filled contours between two levels are also a list/tuple of polygons. Points can be ordered clockwise or anticlockwise.
fig, ax = plt.subplots()

# Filled contours using filled=True.
cs = ContourSet(ax, [0, 1, 2], [filled01, filled12], filled=True, cmap=cm.bone)
cbar = fig.colorbar(cs)

# Contour lines (non-filled).
lines = ContourSet(
    ax, [0, 1, 2], [lines0, lines1, lines2], cmap=cm.cool, linewidths=3)
cbar.add_lines(lines)

ax.set(xlim=(-0.5, 3.5), ylim=(-0.5, 4.5),
       title='User-specified contours')
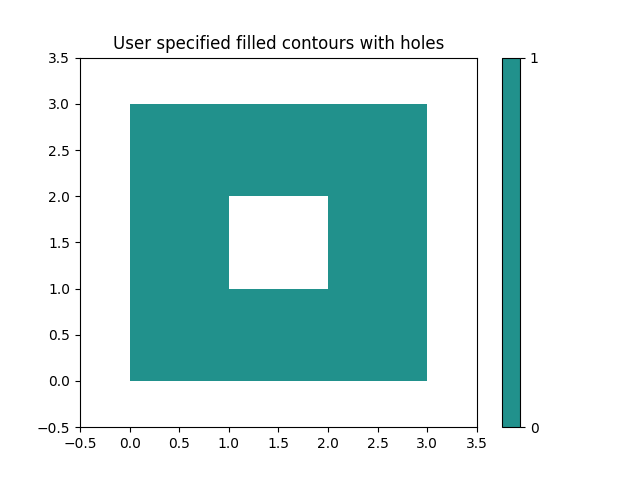
Multiple filled contour lines can be specified in a single list of polygon vertices along with a list of vertex kinds (code types) as described in the Path class. This is particularly useful for polygons with holes. Here a code type of 1 is a MOVETO, and 2 is a LINETO.
fig, ax = plt.subplots()
filled01 = [[[0, 0], [3, 0], [3, 3], [0, 3], [1, 1], [1, 2], [2, 2], [2, 1]]]
kinds01 = [[1, 2, 2, 2, 1, 2, 2, 2]]
cs = ContourSet(ax, [0, 1], [filled01], [kinds01], filled=True)
cbar = fig.colorbar(cs)

ax.set(xlim=(-0.5, 3.5), ylim=(-0.5, 3.5),
       title='User specified filled contours with holes')

plt.show()