Subplots, axes and figures#
Aligning Labels
Programmatically controlling subplot adjustment
Axes box aspect
Axes Demo
Controlling view limits using margins and sticky_edges
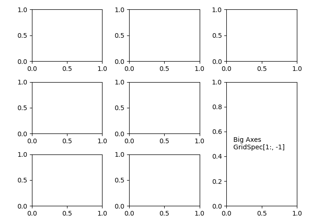
Axes Props
Axes Zoom Effect
axhspan Demo
Equal axis aspect ratio
Axis Label Position
Broken Axis
Placing Colorbars
Custom Figure subclasses
Resizing axes with constrained layout
Resizing axes with tight layout
Different scales on the same axes
Figure size in different units
Figure labels: suptitle, supxlabel, supylabel
Creating adjacent subplots
Geographic Projections
Combining two subplots using subplots and GridSpec
Using Gridspec to make multi-column/row subplot layouts
Nested Gridspecs
Invert Axes
Complex and semantic figure composition (subplot_mosaic)
Managing multiple figures in pyplot
Secondary Axis
Sharing axis limits and views
Shared axis
Figure subfigures
Multiple subplots
Subplots spacings and margins
Creating multiple subplots using plt.subplots
Creating multiple subplots using ``plt.subplots``
Plots with different scales
Zoom region inset axes