Note
Click here to download the full example code
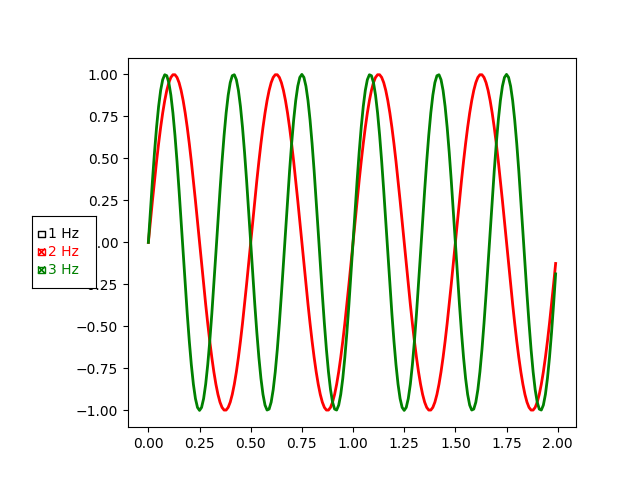
Check buttons#
Turning visual elements on and off with check buttons.
This program shows the use of CheckButtons which is similar to
check boxes. There are 3 different sine waves shown, and we can choose which
waves are displayed with the check buttons.
import numpy as np
import matplotlib.pyplot as plt
from matplotlib.widgets import CheckButtons

t = np.arange(0.0, 2.0, 0.01)
s0 = np.sin(2*np.pi*t)
s1 = np.sin(4*np.pi*t)
s2 = np.sin(6*np.pi*t)

fig, ax = plt.subplots()
l0, = ax.plot(t, s0, visible=False, lw=2, color='black', label='1 Hz')
l1, = ax.plot(t, s1, lw=2, color='red', label='2 Hz')
l2, = ax.plot(t, s2, lw=2, color='green', label='3 Hz')
fig.subplots_adjust(left=0.2)

lines_by_label = {l.get_label(): l for l in [l0, l1, l2]}
line_colors = [l.get_color() for l in lines_by_label.values()]

# Make checkbuttons with all plotted lines with correct visibility
rax = fig.add_axes([0.05, 0.4, 0.1, 0.15])
check = CheckButtons(
    ax=rax,
    labels=lines_by_label.keys(),
    actives=[l.get_visible() for l in lines_by_label.values()],
    label_props={'color': line_colors},
    frame_props={'edgecolor': line_colors},
    check_props={'facecolor': line_colors},
)


def callback(label):
    ln = lines_by_label[label]
    ln.set_visible(not ln.get_visible())
    ln.figure.canvas.draw_idle()

check.on_clicked(callback)

plt.show()
References
The use of the following functions, methods, classes and modules is shown in this example: