Note
Click here to download the full example code
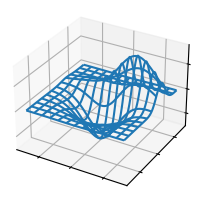
3D wireframe plot#
See plot_wireframe.
from mpl_toolkits.mplot3d import axes3d
import matplotlib.pyplot as plt

plt.style.use('_mpl-gallery')

# Make data
X, Y, Z = axes3d.get_test_data(0.05)

# Plot
fig, ax = plt.subplots(subplot_kw={"projection": "3d"})
ax.plot_wireframe(X, Y, Z, rstride=10, cstride=10)

ax.set(xticklabels=[],
       yticklabels=[],
       zticklabels=[])

plt.show()