Note
Click here to download the full example code
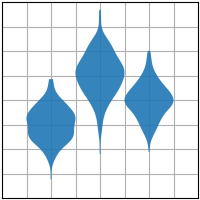
violinplot(D)#
See violinplot.
import matplotlib.pyplot as plt
import numpy as np

plt.style.use('_mpl-gallery')

# make data:
np.random.seed(10)
D = np.random.normal((3, 5, 4), (0.75, 1.00, 0.75), (200, 3))

# plot:
fig, ax = plt.subplots()

vp = ax.violinplot(D, [2, 4, 6], widths=2,
                   showmeans=False, showmedians=False, showextrema=False)
# styling:
for body in vp['bodies']:
    body.set_alpha(0.9)
ax.set(xlim=(0, 8), xticks=np.arange(1, 8),
       ylim=(0, 8), yticks=np.arange(1, 8))

plt.show()