Version 3.1.2
matplotlib.axes.SubplotBase(fig, *args, **kwargs)[source]¶Bases: object
Base class for subplots, which are Axes instances with
additional methods to facilitate generating and manipulating a set
of Axes within a figure.
fig is a matplotlib.figure.Figure instance.
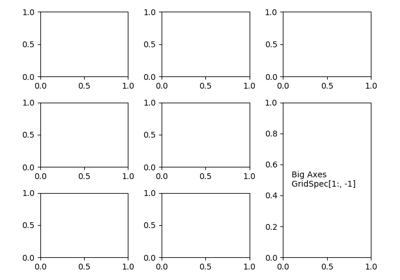
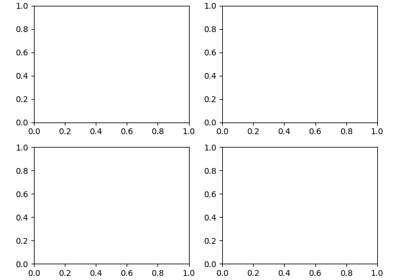
args is the tuple (numRows, numCols, plotNum), where the array of subplots in the figure has dimensions numRows, numCols, and where plotNum is the number of the subplot being created. plotNum starts at 1 in the upper left corner and increases to the right.
If numRows <= numCols <= plotNum < 10, args can be the decimal integer numRows * 100 + numCols * 10 + plotNum.
change_geometry(self, numrows, numcols, num)[source]¶change subplot geometry, e.g., from 1,1,1 to 2,2,3
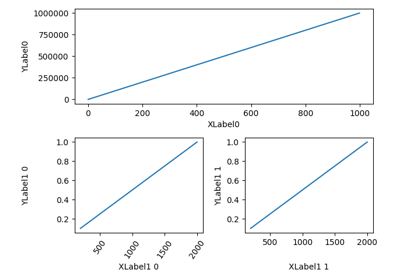
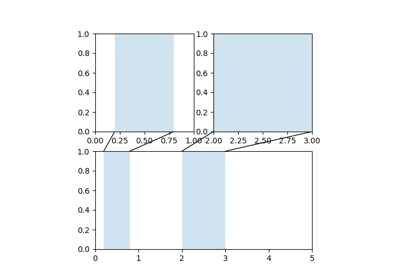
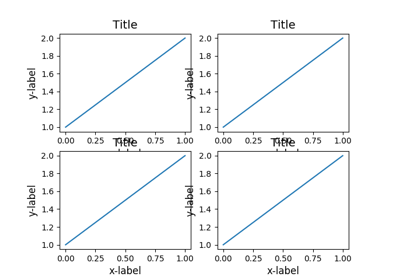
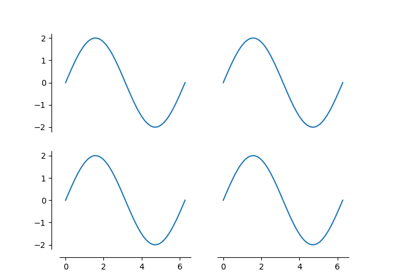
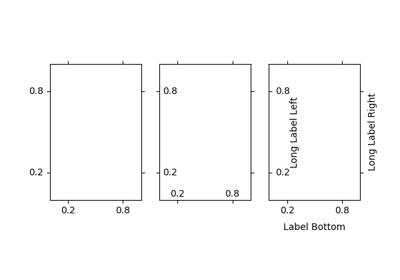
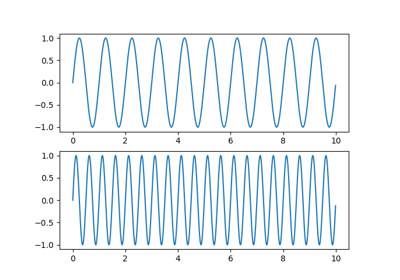
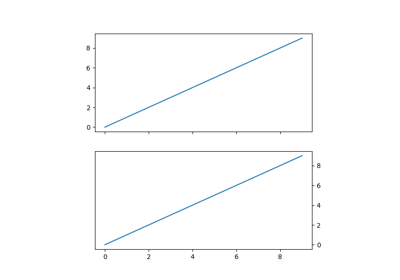
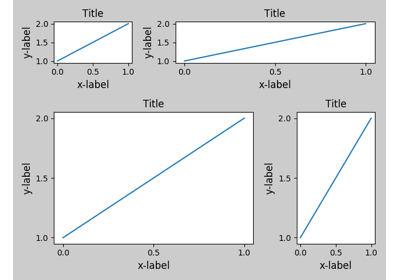
label_outer(self)[source]¶Only show "outer" labels and tick labels.
x-labels are only kept for subplots on the last row; y-labels only for subplots on the first column.
matplotlib.axes.SubplotBase