Version 3.1.2
Note
Click here to download the full example code
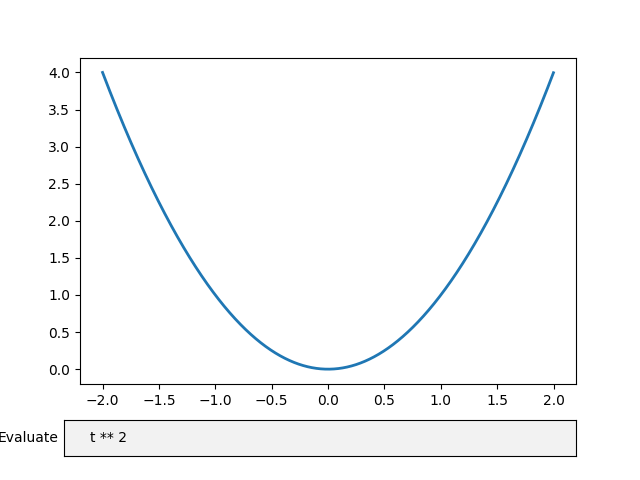
Allowing text input with the Textbox widget.
You can use the Textbox widget to let users provide any text that needs to be displayed, including formulas. You can use a submit button to create plots with the given input.
import numpy as np
import matplotlib.pyplot as plt
from matplotlib.widgets import TextBox
fig, ax = plt.subplots()
plt.subplots_adjust(bottom=0.2)
t = np.arange(-2.0, 2.0, 0.001)
s = t ** 2
initial_text = "t ** 2"
l, = plt.plot(t, s, lw=2)


def submit(text):
    ydata = eval(text)
    l.set_ydata(ydata)
    ax.set_ylim(np.min(ydata), np.max(ydata))
    plt.draw()

axbox = plt.axes([0.1, 0.05, 0.8, 0.075])
text_box = TextBox(axbox, 'Evaluate', initial=initial_text)
text_box.on_submit(submit)

plt.show()
Keywords: matplotlib code example, codex, python plot, pyplot Gallery generated by Sphinx-Gallery