Version 3.1.2
matplotlib.widgets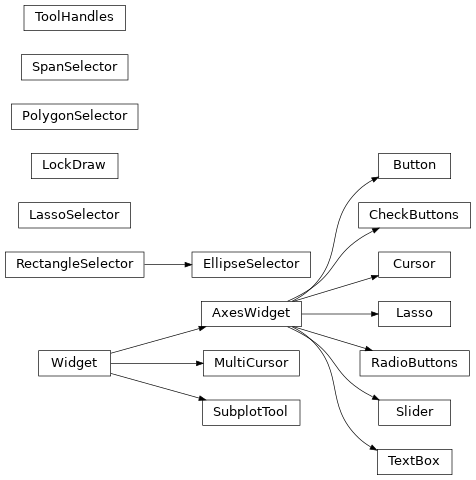
Widgets that are designed to work for any of the GUI backends.
All of these widgets require you to predefine a matplotlib.axes.Axes
instance and pass that as the first arg. matplotlib doesn't try to
be too smart with respect to layout -- you will have to figure out how
wide and tall you want your Axes to be to accommodate your widget.
matplotlib.widgets.AxesWidget(ax)[source]¶Bases: matplotlib.widgets.Widget
Widget that is connected to a single
Axes.
To guarantee that the widget remains responsive and not garbage-collected, a reference to the object should be maintained by the user.
This is necessary because the callback registry maintains only weak-refs to the functions, which are member functions of the widget. If there are no references to the widget object it may be garbage collected which will disconnect the callbacks.
Attributes:
AxesFigureCanvasBase subclassmatplotlib.widgets.Button(ax, label, image=None, color='0.85', hovercolor='0.95')[source]¶Bases: matplotlib.widgets.AxesWidget
A GUI neutral button.
For the button to remain responsive you must keep a reference to it.
Call on_clicked() to connect to the button.
| Attributes: |
|
|---|
| Parameters: |
|
|---|
matplotlib.widgets.CheckButtons(ax, labels, actives=None)[source]¶Bases: matplotlib.widgets.AxesWidget
A GUI neutral set of check buttons.
For the check buttons to remain responsive you must keep a reference to this object.
The following attributes are exposed
- ax
- The
matplotlib.axes.Axesinstance the buttons are located in- labels
- List of
matplotlib.text.Textinstances- lines
- List of (line1, line2) tuples for the x's in the check boxes. These lines exist for each box, but have
set_visible(False)when its box is not checked.- rectangles
- List of
matplotlib.patches.Rectangleinstances
Connect to the CheckButtons with the on_clicked() method
Add check buttons to matplotlib.axes.Axes instance ax
| Parameters: |
|
|---|
matplotlib.widgets.Cursor(ax, horizOn=True, vertOn=True, useblit=False, **lineprops)[source]¶Bases: matplotlib.widgets.AxesWidget
A crosshair cursor that spans the axes and moves with mouse cursor.
For the cursor to remain responsive you must keep a reference to it.
| Parameters: |
|
|---|---|
| Other Parameters: |
Examples
See Cursor.
matplotlib.widgets.EllipseSelector(ax, onselect, drawtype='box', minspanx=None, minspany=None, useblit=False, lineprops=None, rectprops=None, spancoords='data', button=None, maxdist=10, marker_props=None, interactive=False, state_modifier_keys=None)[source]¶Bases: matplotlib.widgets.RectangleSelector
Select an elliptical region of an axes.
For the cursor to remain responsive you must keep a reference to it.
Example usage:
import numpy as np
import matplotlib.pyplot as plt
from matplotlib.widgets import EllipseSelector

def onselect(eclick, erelease):
    "eclick and erelease are matplotlib events at press and release."
    print('startposition: (%f, %f)' % (eclick.xdata, eclick.ydata))
    print('endposition  : (%f, %f)' % (erelease.xdata, erelease.ydata))
    print('used button  : ', eclick.button)

def toggle_selector(event):
    print(' Key pressed.')
    if event.key in ['Q', 'q'] and toggle_selector.ES.active:
        print('EllipseSelector deactivated.')
        toggle_selector.RS.set_active(False)
    if event.key in ['A', 'a'] and not toggle_selector.ES.active:
        print('EllipseSelector activated.')
        toggle_selector.ES.set_active(True)

x = np.arange(100.) / 99
y = np.sin(x)
fig, ax = plt.subplots()
ax.plot(x, y)

toggle_selector.ES = EllipseSelector(ax, onselect, drawtype='line')
fig.canvas.mpl_connect('key_press_event', toggle_selector)
plt.show()
Create a selector in ax. When a selection is made, clear the span and call onselect with:
onselect(pos_1, pos_2)
and clear the drawn box/line. The pos_1 and pos_2 are
arrays of length 2 containing the x- and y-coordinate.
If minspanx is not None then events smaller than minspanx in x direction are ignored (it's the same for y).
The rectangle is drawn with rectprops; default:
rectprops = dict(facecolor='red', edgecolor = 'black',
                 alpha=0.2, fill=True)
The line is drawn with lineprops; default:
lineprops = dict(color='black', linestyle='-',
                 linewidth = 2, alpha=0.5)
Use drawtype if you want the mouse to draw a line, a box or nothing between click and actual position by setting
drawtype = 'line', drawtype='box' or drawtype = 'none'.
Drawing a line would result in a line from vertex A to vertex C in
a rectangle ABCD.
spancoords is one of 'data' or 'pixels'. If 'data', minspanx and minspanx will be interpreted in the same coordinates as the x and y axis. If 'pixels', they are in pixels.
button is a list of integers indicating which mouse buttons should be used for rectangle selection. You can also specify a single integer if only a single button is desired. Default is None, which does not limit which button can be used.
interactive will draw a set of handles and allow you interact with the widget after it is drawn.
state_modifier_keys are keyboard modifiers that affect the behavior of the widget.
The defaults are: dict(move=' ', clear='escape', square='shift', center='ctrl')
Keyboard modifiers, which: 'move': Move the existing shape. 'clear': Clear the current shape. 'square': Makes the shape square. 'center': Make the initial point the center of the shape. 'square' and 'center' can be combined.
matplotlib.widgets.Lasso(ax, xy, callback=None, useblit=True)[source]¶Bases: matplotlib.widgets.AxesWidget
Selection curve of an arbitrary shape.
The selected path can be used in conjunction with
contains_point() to select data points
from an image.
Unlike LassoSelector, this must be initialized with a starting
point xy, and the Lasso events are destroyed upon release.
| Parameters: |
|
|---|
matplotlib.widgets.LassoSelector(ax, onselect=None, useblit=True, lineprops=None, button=None)[source]¶Bases: matplotlib.widgets._SelectorWidget
Selection curve of an arbitrary shape.
For the selector to remain responsive you must keep a reference to it.
The selected path can be used in conjunction with contains_point
to select data points from an image.
In contrast to Lasso, LassoSelector is written with an interface
similar to RectangleSelector and SpanSelector, and will continue to
interact with the axes until disconnected.
Example usage:
ax = subplot(111)
ax.plot(x,y)

def onselect(verts):
    print(verts)
lasso = LassoSelector(ax, onselect)
| Parameters: |
|
|---|
matplotlib.widgets.LockDraw[source]¶Bases: object
Some widgets, like the cursor, draw onto the canvas, and this is not
desirable under all circumstances, like when the toolbar is in zoom-to-rect
mode and drawing a rectangle. To avoid this, a widget can acquire a
canvas' lock with canvas.widgetlock(widget) before drawing on the
canvas; this will prevent other widgets from doing so at the same time (if
they also try to acquire the lock first).
matplotlib.widgets.MultiCursor(canvas, axes, useblit=True, horizOn=False, vertOn=True, **lineprops)[source]¶Bases: matplotlib.widgets.Widget
Provide a vertical (default) and/or horizontal line cursor shared between multiple axes.
For the cursor to remain responsive you must keep a reference to it.
Example usage:
from matplotlib.widgets import MultiCursor
import matplotlib.pyplot as plt
import numpy as np

fig, (ax1, ax2) = plt.subplots(nrows=2, sharex=True)
t = np.arange(0.0, 2.0, 0.01)
ax1.plot(t, np.sin(2*np.pi*t))
ax2.plot(t, np.sin(4*np.pi*t))

multi = MultiCursor(fig.canvas, (ax1, ax2), color='r', lw=1,
                    horizOn=False, vertOn=True)
plt.show()
matplotlib.widgets.PolygonSelector(ax, onselect, useblit=False, lineprops=None, markerprops=None, vertex_select_radius=15)[source]¶Bases: matplotlib.widgets._SelectorWidget
Select a polygon region of an axes.
Place vertices with each mouse click, and make the selection by completing the polygon (clicking on the first vertex). Hold the ctrl key and click and drag a vertex to reposition it (the ctrl key is not necessary if the polygon has already been completed). Hold the shift key and click and drag anywhere in the axes to move all vertices. Press the esc key to start a new polygon.
For the selector to remain responsive you must keep a reference to it.
| Parameters: |
|
|---|
Examples
verts¶Get the polygon vertices.
| Returns: |
|
|---|
matplotlib.widgets.RadioButtons(ax, labels, active=0, activecolor='blue')[source]¶Bases: matplotlib.widgets.AxesWidget
A GUI neutral radio button.
For the buttons to remain responsive you must keep a reference to this object.
Connect to the RadioButtons with the on_clicked() method.
| Attributes: |
|---|
Add radio buttons to an Axes.
| Parameters: |
|
|---|
matplotlib.widgets.RectangleSelector(ax, onselect, drawtype='box', minspanx=None, minspany=None, useblit=False, lineprops=None, rectprops=None, spancoords='data', button=None, maxdist=10, marker_props=None, interactive=False, state_modifier_keys=None)[source]¶Bases: matplotlib.widgets._SelectorWidget
Select a rectangular region of an axes.
For the cursor to remain responsive you must keep a reference to it.
Example usage:
import numpy as np
import matplotlib.pyplot as plt
from matplotlib.widgets import RectangleSelector

def onselect(eclick, erelease):
    "eclick and erelease are matplotlib events at press and release."
    print('startposition: (%f, %f)' % (eclick.xdata, eclick.ydata))
    print('endposition  : (%f, %f)' % (erelease.xdata, erelease.ydata))
    print('used button  : ', eclick.button)

def toggle_selector(event):
    print('Key pressed.')
    if event.key in ['Q', 'q'] and toggle_selector.RS.active:
        print('RectangleSelector deactivated.')
        toggle_selector.RS.set_active(False)
    if event.key in ['A', 'a'] and not toggle_selector.RS.active:
        print('RectangleSelector activated.')
        toggle_selector.RS.set_active(True)

x = np.arange(100.) / 99
y = np.sin(x)
fig, ax = plt.subplots()
ax.plot(x, y)

toggle_selector.RS = RectangleSelector(ax, onselect, drawtype='line')
fig.canvas.mpl_connect('key_press_event', toggle_selector)
plt.show()
Create a selector in ax. When a selection is made, clear the span and call onselect with:
onselect(pos_1, pos_2)
and clear the drawn box/line. The pos_1 and pos_2 are
arrays of length 2 containing the x- and y-coordinate.
If minspanx is not None then events smaller than minspanx in x direction are ignored (it's the same for y).
The rectangle is drawn with rectprops; default:
rectprops = dict(facecolor='red', edgecolor = 'black',
                 alpha=0.2, fill=True)
The line is drawn with lineprops; default:
lineprops = dict(color='black', linestyle='-',
                 linewidth = 2, alpha=0.5)
Use drawtype if you want the mouse to draw a line, a box or nothing between click and actual position by setting
drawtype = 'line', drawtype='box' or drawtype = 'none'.
Drawing a line would result in a line from vertex A to vertex C in
a rectangle ABCD.
spancoords is one of 'data' or 'pixels'. If 'data', minspanx and minspanx will be interpreted in the same coordinates as the x and y axis. If 'pixels', they are in pixels.
button is a list of integers indicating which mouse buttons should be used for rectangle selection. You can also specify a single integer if only a single button is desired. Default is None, which does not limit which button can be used.
interactive will draw a set of handles and allow you interact with the widget after it is drawn.
state_modifier_keys are keyboard modifiers that affect the behavior of the widget.
The defaults are: dict(move=' ', clear='escape', square='shift', center='ctrl')
Keyboard modifiers, which: 'move': Move the existing shape. 'clear': Clear the current shape. 'square': Makes the shape square. 'center': Make the initial point the center of the shape. 'square' and 'center' can be combined.
center¶Center of rectangle
corners¶Corners of rectangle from lower left, moving clockwise.
edge_centers¶Midpoint of rectangle edges from left, moving clockwise.
extents¶Return (xmin, xmax, ymin, ymax).
geometry¶Returns numpy.ndarray of shape (2,5) containing
x (RectangleSelector.geometry[1,:]) and
y (RectangleSelector.geometry[0,:])
coordinates of the four corners of the rectangle starting
and ending in the top left corner.
matplotlib.widgets.Slider(ax, label, valmin, valmax, valinit=0.5, valfmt='%1.2f', closedmin=True, closedmax=True, slidermin=None, slidermax=None, dragging=True, valstep=None, orientation='horizontal', **kwargs)[source]¶Bases: matplotlib.widgets.AxesWidget
A slider representing a floating point range.
Create a slider from valmin to valmax in axes ax. For the slider to
remain responsive you must maintain a reference to it. Call
on_changed() to connect to the slider event.
| Attributes: |
|
|---|
| Parameters: |
|
|---|
Notes
Additional kwargs are passed on to self.poly which is the
Rectangle that draws the slider
knob. See the Rectangle documentation for
valid property names (e.g., facecolor, edgecolor, alpha).
disconnect(self, cid)[source]¶Remove the observer with connection id cid
| Parameters: |
|
|---|
matplotlib.widgets.SpanSelector(ax, onselect, direction, minspan=None, useblit=False, rectprops=None, onmove_callback=None, span_stays=False, button=None)[source]¶Bases: matplotlib.widgets._SelectorWidget
Visually select a min/max range on a single axis and call a function with those values.
To guarantee that the selector remains responsive, keep a reference to it.
In order to turn off the SpanSelector, set span_selector.active=False. To
turn it back on, set span_selector.active=True.
| Parameters: |
|
|---|
Examples
>>> import matplotlib.pyplot as plt
>>> import matplotlib.widgets as mwidgets
>>> fig, ax = plt.subplots()
>>> ax.plot([1, 2, 3], [10, 50, 100])
>>> def onselect(vmin, vmax):
...     print(vmin, vmax)
>>> rectprops = dict(facecolor='blue', alpha=0.5)
>>> span = mwidgets.SpanSelector(ax, onselect, 'horizontal',
...                              rectprops=rectprops)
>>> fig.show()
See also: Span Selector
matplotlib.widgets.SubplotTool(targetfig, toolfig)[source]¶Bases: matplotlib.widgets.Widget
A tool to adjust the subplot params of a matplotlib.figure.Figure.
matplotlib.widgets.TextBox(ax, label, initial='', color='.95', hovercolor='1', label_pad=0.01)[source]¶Bases: matplotlib.widgets.AxesWidget
A GUI neutral text input box.
For the text box to remain responsive you must keep a reference to it.
The following attributes are accessible:
- ax
- The
matplotlib.axes.Axesthe button renders into.- label
- A
matplotlib.text.Textinstance.- color
- The color of the text box when not hovering.
- hovercolor
- The color of the text box when hovering.
Call on_text_change() to be updated whenever the text changes.
Call on_submit() to be updated whenever the user hits enter or
leaves the text entry field.
| Parameters: |
|
|---|
on_submit(self, func)[source]¶When the user hits enter or leaves the submission box, call this func with event.
A connection id is returned which can be used to disconnect.
matplotlib.widgets.ToolHandles(ax, x, y, marker='o', marker_props=None, useblit=True)[source]¶Bases: object
Control handles for canvas tools.
| Parameters: |
|
|---|
x¶y¶matplotlib.widgets.Widget[source]¶Bases: object
Abstract base class for GUI neutral widgets
active¶Is the widget active?
drawon = True¶eventson = True