Version 3.1.2
Note
Click here to download the full example code
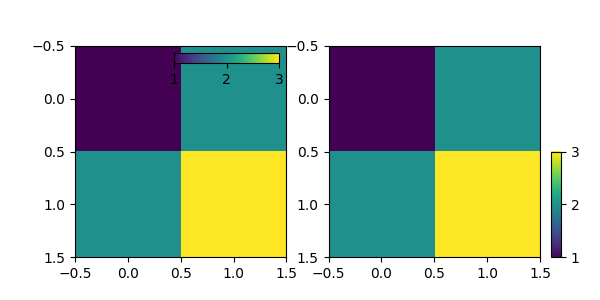
This example shows how to control the position, height, and width of
colorbars using inset_axes.
Controlling the placement of the inset axes is done similarly as that of the legend: either by providing a location option ("upper right", "best", ...), or by providing a locator with respect to the parent bbox.
import matplotlib.pyplot as plt

from mpl_toolkits.axes_grid1.inset_locator import inset_axes

fig, (ax1, ax2) = plt.subplots(1, 2, figsize=[6, 3])

axins1 = inset_axes(ax1,
                    width="50%",  # width = 50% of parent_bbox width
                    height="5%",  # height : 5%
                    loc='upper right')

im1 = ax1.imshow([[1, 2], [2, 3]])
fig.colorbar(im1, cax=axins1, orientation="horizontal", ticks=[1, 2, 3])
axins1.xaxis.set_ticks_position("bottom")

axins = inset_axes(ax2,
                   width="5%",  # width = 5% of parent_bbox width
                   height="50%",  # height : 50%
                   loc='lower left',
                   bbox_to_anchor=(1.05, 0., 1, 1),
                   bbox_transform=ax2.transAxes,
                   borderpad=0,
                   )

# Controlling the placement of the inset axes is basically same as that
# of the legend.  you may want to play with the borderpad value and
# the bbox_to_anchor coordinate.

im = ax2.imshow([[1, 2], [2, 3]])
fig.colorbar(im, cax=axins, ticks=[1, 2, 3])

plt.show()
Keywords: matplotlib code example, codex, python plot, pyplot Gallery generated by Sphinx-Gallery