Version 3.1.2
Note
Click here to download the full example code
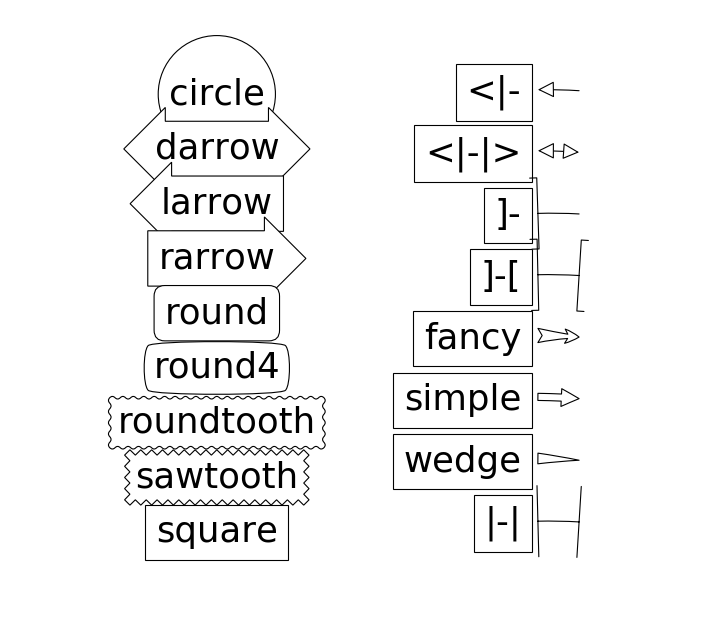
Create fancy box and arrow styles.
import matplotlib.patches as mpatch
import matplotlib.pyplot as plt

figheight = 8
fig = plt.figure(figsize=(9, figheight), dpi=80)
fontsize = 0.4 * fig.dpi

def make_boxstyles(ax):
    styles = mpatch.BoxStyle.get_styles()

    for i, (stylename, styleclass) in enumerate(sorted(styles.items())):
        ax.text(0.5, (float(len(styles)) - 0.5 - i)/len(styles), stylename,
                  ha="center",
                  size=fontsize,
                  transform=ax.transAxes,
                  bbox=dict(boxstyle=stylename, fc="w", ec="k"))

def make_arrowstyles(ax):
    styles = mpatch.ArrowStyle.get_styles()

    ax.set_xlim(0, 4)
    ax.set_ylim(0, figheight)

    for i, (stylename, styleclass) in enumerate(sorted(styles.items())):
        y = (float(len(styles)) - 0.25 - i)  # /figheight
        p = mpatch.Circle((3.2, y), 0.2, fc="w")
        ax.add_patch(p)

        ax.annotate(stylename, (3.2, y),
                    (2., y),
                    # xycoords="figure fraction", textcoords="figure fraction",
                    ha="right", va="center",
                    size=fontsize,
                    arrowprops=dict(arrowstyle=stylename,
                                    patchB=p,
                                    shrinkA=5,
                                    shrinkB=5,
                                    fc="w", ec="k",
                                    connectionstyle="arc3,rad=-0.05",
                                    ),
                    bbox=dict(boxstyle="square", fc="w"))

    ax.xaxis.set_visible(False)
    ax.yaxis.set_visible(False)


ax1 = fig.add_subplot(121, frameon=False, xticks=[], yticks=[])
make_boxstyles(ax1)

ax2 = fig.add_subplot(122, frameon=False, xticks=[], yticks=[])
make_arrowstyles(ax2)


plt.show()
The use of the following functions, methods, classes and modules is shown in this example:
import matplotlib
matplotlib.patches
matplotlib.patches.BoxStyle
matplotlib.patches.BoxStyle.get_styles
matplotlib.patches.ArrowStyle
matplotlib.patches.ArrowStyle.get_styles
matplotlib.axes.Axes.text
matplotlib.axes.Axes.annotate
Out:
<function Axes.annotate at 0x7fb11b449268>
Keywords: matplotlib code example, codex, python plot, pyplot Gallery generated by Sphinx-Gallery