Version 3.1.2
Note
Click here to download the full example code
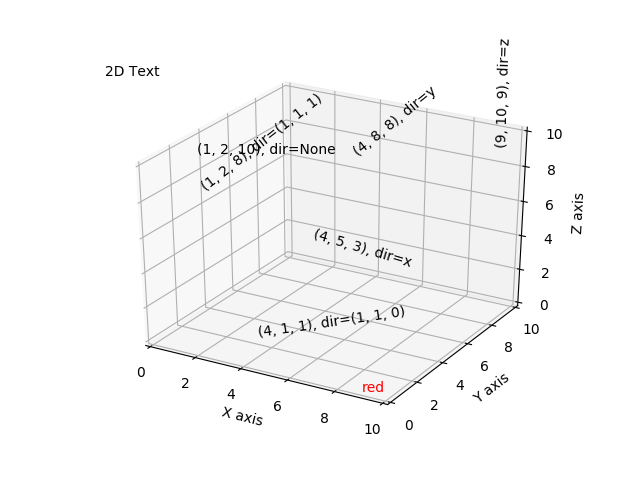
Demonstrates the placement of text annotations on a 3D plot.
Functionality shown:
- Using the text function with three types of 'zdir' values: None, an axis name (ex. 'x'), or a direction tuple (ex. (1, 1, 0)).
- Using the text function with the color keyword.
- Using the text2D function to place text on a fixed position on the ax object.
# This import registers the 3D projection, but is otherwise unused.
from mpl_toolkits.mplot3d import Axes3D  # noqa: F401 unused import

import matplotlib.pyplot as plt


fig = plt.figure()
ax = fig.gca(projection='3d')

# Demo 1: zdir
zdirs = (None, 'x', 'y', 'z', (1, 1, 0), (1, 1, 1))
xs = (1, 4, 4, 9, 4, 1)
ys = (2, 5, 8, 10, 1, 2)
zs = (10, 3, 8, 9, 1, 8)

for zdir, x, y, z in zip(zdirs, xs, ys, zs):
    label = '(%d, %d, %d), dir=%s' % (x, y, z, zdir)
    ax.text(x, y, z, label, zdir)

# Demo 2: color
ax.text(9, 0, 0, "red", color='red')

# Demo 3: text2D
# Placement 0, 0 would be the bottom left, 1, 1 would be the top right.
ax.text2D(0.05, 0.95, "2D Text", transform=ax.transAxes)

# Tweaking display region and labels
ax.set_xlim(0, 10)
ax.set_ylim(0, 10)
ax.set_zlim(0, 10)
ax.set_xlabel('X axis')
ax.set_ylabel('Y axis')
ax.set_zlabel('Z axis')

plt.show()
Keywords: matplotlib code example, codex, python plot, pyplot Gallery generated by Sphinx-Gallery