Version 3.1.2
Note
Click here to download the full example code
Working with multiple figure windows and subplots
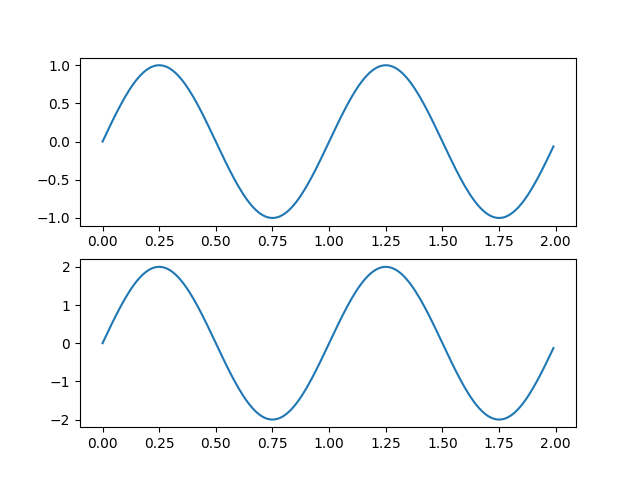
Create figure 1
plt.figure(1)
plt.subplot(211)
plt.plot(t, s1)
plt.subplot(212)
plt.plot(t, 2*s1)
Out:
[<matplotlib.lines.Line2D object at 0x7fb114e4e780>]
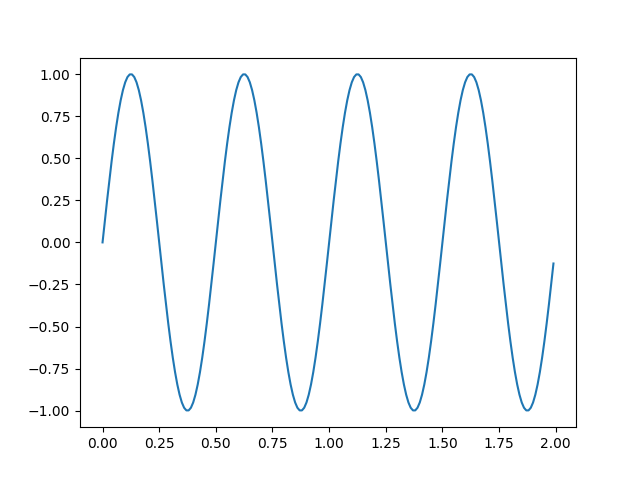
Create figure 2
plt.figure(2)
plt.plot(t, s2)
Out:
[<matplotlib.lines.Line2D object at 0x7fb1144ce5f8>]
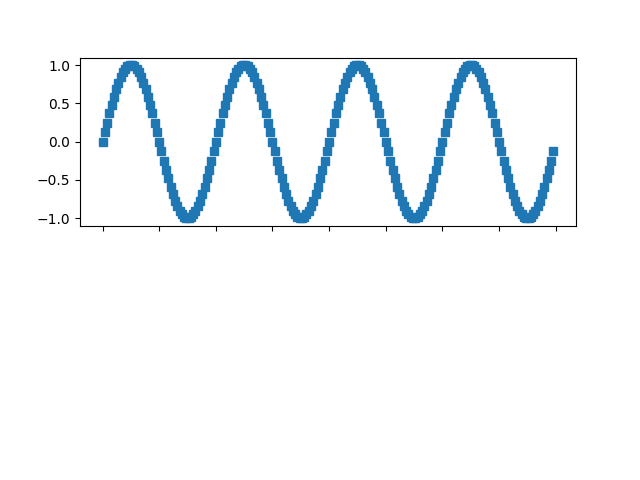
Now switch back to figure 1 and make some changes
plt.figure(1)
plt.subplot(211)
plt.plot(t, s2, 's')
ax = plt.gca()
ax.set_xticklabels([])

plt.show()
Keywords: matplotlib code example, codex, python plot, pyplot Gallery generated by Sphinx-Gallery